OPEN-SOURCE SCRIPT
sadosi trends and barrier
This indicator should be used for give ideas.
what they can do?
how can?
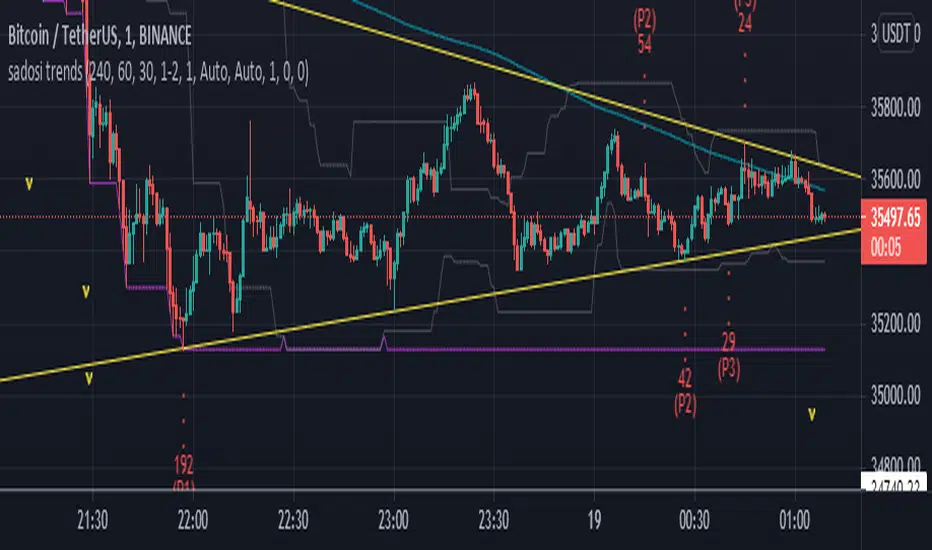
By analyzing the prices in the 3 selected periods, 3 highs and 3 lows prices are marked. With the marked points, trend and resistance lines are drawn. The current price is analyzed and useful calculations displayed in the info box. Finaly adding moving averages. After all these transactions, the trend and resistances become easily visible on the chart.
You can fine-tune the angle of the trend using high and low extensions
you can catch different trend lines by changing the high and low trend points
By changing the periods, you can set position the trend lines more accurately.
When the price is too low or too high, the information box will warn you by change color.
The trend lines to be created are for the purpose of giving an idea and convenience. It can be used on all timeframes, including horizontal trends.
what they can do?
- draw up and down trend lines
- draw support and resistance lines
- to inform about the current price
- signal for high and low prices
how can?
By analyzing the prices in the 3 selected periods, 3 highs and 3 lows prices are marked. With the marked points, trend and resistance lines are drawn. The current price is analyzed and useful calculations displayed in the info box. Finaly adding moving averages. After all these transactions, the trend and resistances become easily visible on the chart.
You can fine-tune the angle of the trend using high and low extensions
you can catch different trend lines by changing the high and low trend points
By changing the periods, you can set position the trend lines more accurately.
When the price is too low or too high, the information box will warn you by change color.
The trend lines to be created are for the purpose of giving an idea and convenience. It can be used on all timeframes, including horizontal trends.
Script open-source
Nello spirito di TradingView, l'autore di questo script lo ha reso open source, in modo che i trader possano esaminarne e verificarne la funzionalità. Complimenti all'autore! Sebbene sia possibile utilizzarlo gratuitamente, ricordiamo che la ripubblicazione del codice è soggetta al nostro Regolamento.
Declinazione di responsabilità
Le informazioni e le pubblicazioni non sono intese come, e non costituiscono, consulenza o raccomandazioni finanziarie, di investimento, di trading o di altro tipo fornite o approvate da TradingView. Per ulteriori informazioni, consultare i Termini di utilizzo.