OPEN-SOURCE SCRIPT
Aggiornato [blackcat] L3 MACD plus Candles
Level: 3
Background
Many people need to judge the market trend against the main candlestick chart when using MACD.
Function
First of all, the principle of MACD is the difference between EMA's long-term and short-term values. So, I wonder if it is possible to use EMA to construct a set of candle charts that are similar in proportion to MACD values for overlapping comparisons? Because this can greatly facilitate traders to make quick trend judgments. So I used the 3-8 lines of EMA to simulate the KD of KDJ, constructed a set of candle charts, and generated buying and selling points through conditional constraints. Do you like this MACD + Candlestick chart?
Inputs
N/A
Key Signal
Traditional MACD output signal
Candlesticks
Near Top --> Top is reached and reversal may happen soon. (fuchsia labels)
Near Bottom --> Bottom is reached and reversal may happen soon. (yellow labels)
Remarks
This is a Level 3 free and open source indicator.
Feedbacks are appreciated.
Note di rilascio
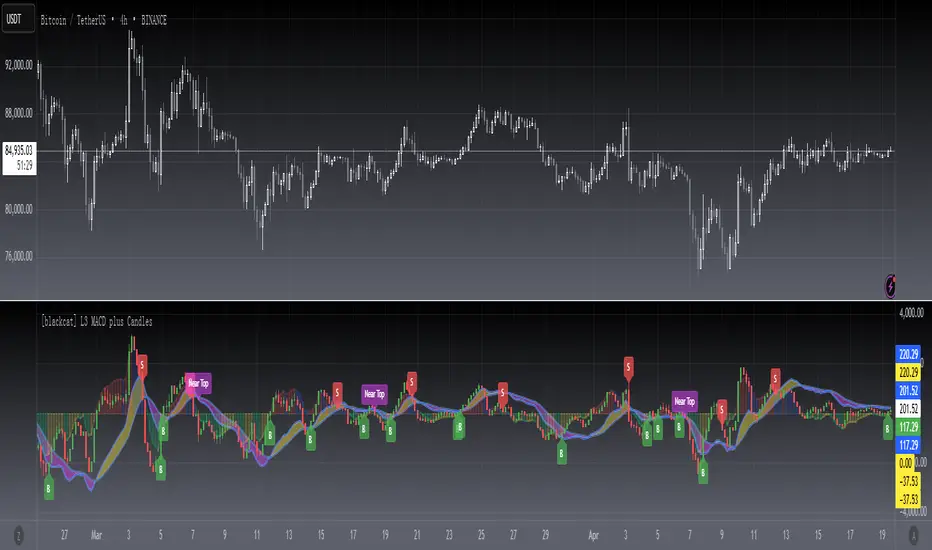
OVERVIEWThe [blackcat] L3 MACD plus Candles indicator combines Moving Average Convergence Divergence (MACD) with Exponential Moving Averages (EMA) to provide a comprehensive view of market trends and potential reversal points. This indicator plots MACD lines, histograms, and custom candlesticks based on EMA differences, helping traders identify buy and sell signals more effectively 📊💹.
FEATURES
Calculates and plots MACD Line, Signal Line, and Histogram
Plots custom candlesticks based on EMA differences:
Green for bullish conditions.
Red for bearish conditions.
Identifies and plots near-top and near-bottom zones using MACD crossovers 🏆⬇️
Generates clear buy ('B') and sell ('S') labels on the chart for easy visualization 🏷️
Provides alerts for buy and sell signals to aid in timely decision-making 🔔
Supports customizable colors and line widths for plotted elements ⚙️
HOW TO USE
Add the indicator to your TradingView chart by selecting it from the indicators list.
Observe the plotted MACD lines, histograms, and custom candlesticks on the chart.
Monitor the generated buy ('B') and sell ('S') labels indicating potential trade opportunities.
Set up alerts based on the generated signals to receive notifications when conditions are met 📲.
Combine this indicator with other tools for confirmation before making trading decisions.
LIMITATIONS
The indicator relies heavily on MACD and EMAs, which might not capture all market nuances.
False signals can occur in ranging or sideways markets 🌪️.
Users should always confirm signals with other forms of analysis.
NOTES
Ensure that you have sufficient historical data available for accurate calculations.
Test the indicator thoroughly on demo accounts before applying it to live trading 🔍.
Customize the appearance of the plotted elements as needed to fit your preferences.
Script open-source
Nello spirito di TradingView, l'autore di questo script lo ha reso open source, in modo che i trader possano esaminarne e verificarne la funzionalità. Complimenti all'autore! Sebbene sia possibile utilizzarlo gratuitamente, ricordiamo che la ripubblicazione del codice è soggetta al nostro Regolamento.
Avoid losing contact!Don't miss out! The first and most important thing to do is to join my Discord chat now! Click here to start your adventure: discord.com/invite/ZTGpQJq 防止失联,请立即行动,加入本猫聊天群: discord.com/invite/ZTGpQJq
Declinazione di responsabilità
Le informazioni e le pubblicazioni non sono intese come, e non costituiscono, consulenza o raccomandazioni finanziarie, di investimento, di trading o di altro tipo fornite o approvate da TradingView. Per ulteriori informazioni, consultare i Termini di utilizzo.