OPEN-SOURCE SCRIPT
Multi TF Trend Indicator
...Mark Douglas in his book Trading in the Zone wrote
The longer the time frame, the more significant the trend, so a trending market on a daily bar chart is more significant than a trending market on a 30-minute bar chart. Therefore, the trend on the daily bar chart would take precedence over the trend on the 30-minute bar chart and would be considered the major trend. To determine the direction of the major trend, look at what is happening on a daily bar chart. If the trend is up on the daily, you are only going to look for a sell-off or retracement down to what your edge defines as support on the 30-minute chart. That's where you will become a buyer. On the other hand, if the trend is down on the daily, you are only going to look for a rally up to what your edge defines as a resistance level to be a seller on the 30-minute chart. Your objective is to determine, in a downtrending market, how far it can rally on an intraday basis and still not violate the symmetry of the longer trend. In an up-trending market, your objective is to determine how far it can sell off on an intraday basis without violating the symmetry of the longer trend. There's usually very little risk associated with these intraday support and resistance points, because you don't have to let the market go very far beyond them to tell you the trade isn't working.
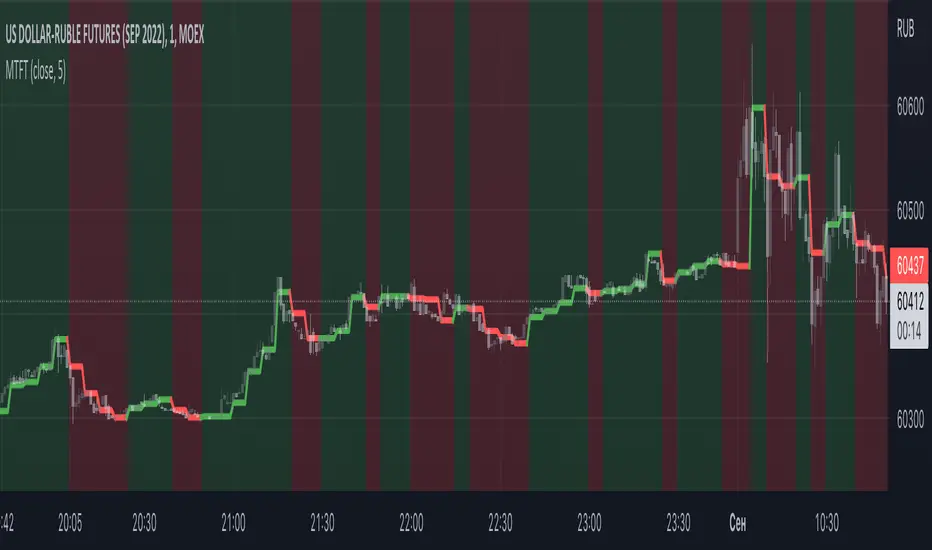
The purpose of this indicator to show both the major and minor trend on the same chart with no need to switch between timeframes
Script includes
- timeframe to determine the major trend
- price curve, close price is default, but you can pick MA you want
- type of coloring, either curve color or the background color
Implementation details
- major trend is determined by the slope of the price curve
Further improvements
- a variation of techniques for determining the major trend (crossing MA, pivot points etc.)
- major trend change alerts
Thanks loxx for pullData helper function
Script open-source
In pieno spirito TradingView, il creatore di questo script lo ha reso open-source, in modo che i trader possano esaminarlo e verificarne la funzionalità. Complimenti all'autore! Sebbene sia possibile utilizzarlo gratuitamente, ricorda che la ripubblicazione del codice è soggetta al nostro Regolamento.
Declinazione di responsabilità
Le informazioni ed i contenuti pubblicati non costituiscono in alcun modo una sollecitazione ad investire o ad operare nei mercati finanziari. Non sono inoltre fornite o supportate da TradingView. Maggiori dettagli nelle Condizioni d'uso.