INVITE-ONLY SCRIPT
ATR Exhaustion
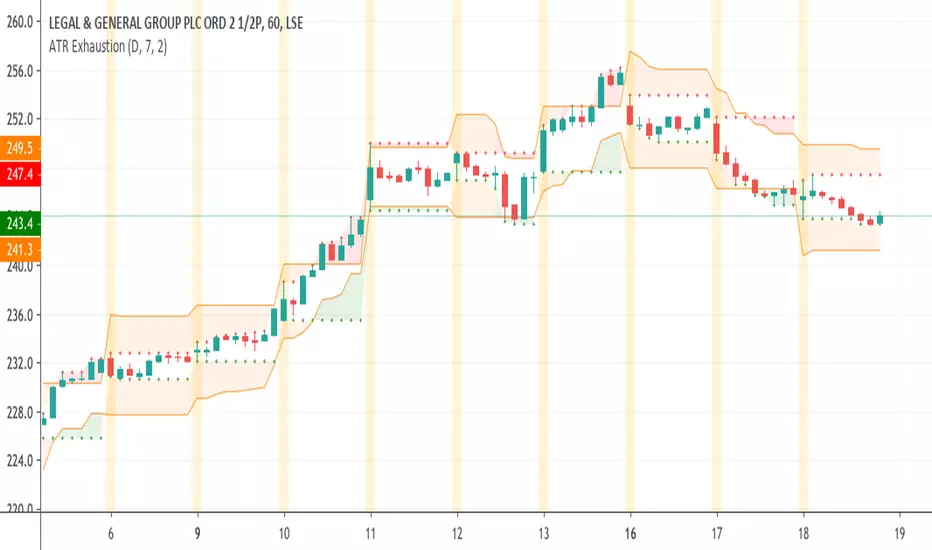
The ATR Exhaustion indicator for Tradingview will overlay the minimum and maximum price limits for a timeframe over your chart. It calculates the price limits be adding and subtracting the ATR level from the high and lows of the period you are interested in.
For example, you can see the daily upper and lower ATR levels whilst on a 15-minute chart. The upper and lower ranges will update as price moves.
Why would this be useful?
It the true price range on average does not move more than x pips/points, then the range boundaries might provide support/resistance levels as price approaches the levels. Additionally, you can use this tool to easily identify how volatile price action has been in comparison to previous periods.
Features
- Easily see ATR Exhaustion areas in any timeframe
- Period highs and lows are plotted and updated as price action unfolds
- Color fills change when price moves beyond the ATR range for easy identification of periods of strong trends or volatility.
Script su invito
L'accesso a questo script è riservato agli utenti autorizzati dall'autore, solitamente dietro pagamento di una commissione. Puoi aggiungerlo ai preferiti, ma sarai in grado di utilizzarlo solo una volta ricevuto il via libera da parte dell'autore. Per ulteriori informazioni, contatta BacktestRookies o segui le istruzioni dell'autore riportate di seguito.
TradingView non suggerisce di pagare per uno script e di utilizzarlo a meno che non ci si fidi al 100% del suo autore e non si comprenda il suo funzionamento. In molti casi, è possibile trovare gratuitamente una buona alternativa open-source nei nostri Script della comunità.
Istruzioni dell'autore
″
Vuoi usare questo script sui tuoi grafici?
Attenzione: leggi prima di richiedere l'accesso.
Declinazione di responsabilità
Le informazioni ed i contenuti pubblicati non costituiscono in alcun modo una sollecitazione ad investire o ad operare nei mercati finanziari. Non sono inoltre fornite o supportate da TradingView. Maggiori dettagli nelle Condizioni d'uso.