OPEN-SOURCE SCRIPT
Self-Adjusting RSI +
Here is an open source (no request needed!) version of the Self-Adjusting RSI by David Sepiashvili.
Published in Stocks & Commodities V. 24:2 (February, 2006): The Self-Adjusting RSI
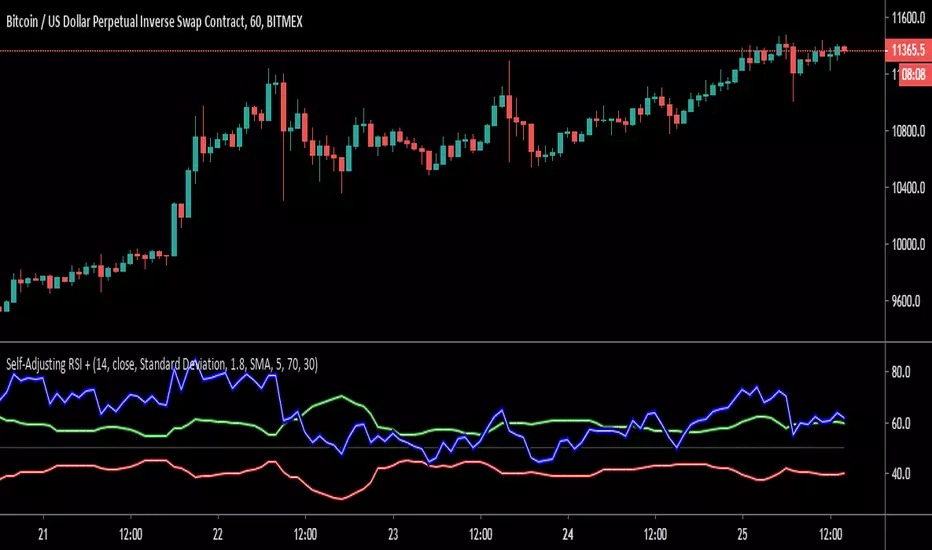
David Sepiashvili's article, "The Self-Adjusting RSI," presents a technique to adjust the traditional RSI overbought and oversold thresholds so as to ensure that 70-80% of RSI values lie between the two thresholds. Sepiashvili presents two algorithms for adjusting the thresholds. One is based on standard deviation, the other on a simple moving average of the RSI.
This script allows you to choose between plotting the Self-Adjusting bands or the traditional bands. You can also plot a smoothed RSI (SMA or EMA) and change the theme color for dark or light charts.
If you find this code useful, please pass it forward by sharing open source!
Thank you to all of the open source heroes out there!
"If I have seen a little further it is by standing on the shoulders of Giants."
Published in Stocks & Commodities V. 24:2 (February, 2006): The Self-Adjusting RSI
David Sepiashvili's article, "The Self-Adjusting RSI," presents a technique to adjust the traditional RSI overbought and oversold thresholds so as to ensure that 70-80% of RSI values lie between the two thresholds. Sepiashvili presents two algorithms for adjusting the thresholds. One is based on standard deviation, the other on a simple moving average of the RSI.
This script allows you to choose between plotting the Self-Adjusting bands or the traditional bands. You can also plot a smoothed RSI (SMA or EMA) and change the theme color for dark or light charts.
If you find this code useful, please pass it forward by sharing open source!
Thank you to all of the open source heroes out there!
"If I have seen a little further it is by standing on the shoulders of Giants."
Script open-source
Nello spirito di TradingView, l'autore di questo script lo ha reso open source, in modo che i trader possano esaminarne e verificarne la funzionalità. Complimenti all'autore! Sebbene sia possibile utilizzarlo gratuitamente, ricordiamo che la ripubblicazione del codice è soggetta al nostro Regolamento.
Declinazione di responsabilità
Le informazioni e le pubblicazioni non sono intese come, e non costituiscono, consulenza o raccomandazioni finanziarie, di investimento, di trading o di altro tipo fornite o approvate da TradingView. Per ulteriori informazioni, consultare i Termini di utilizzo.