OPEN-SOURCE SCRIPT
Aggiornato True Range Osc
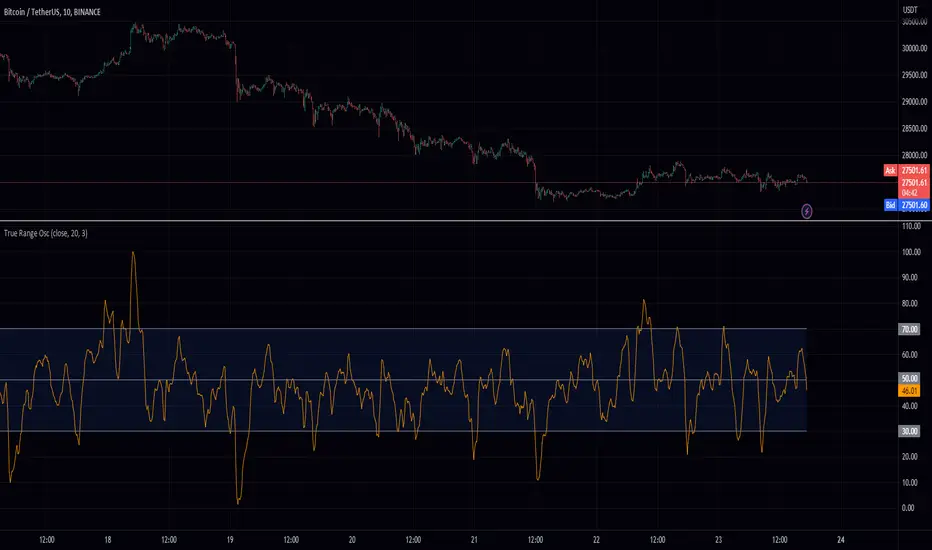
Hey fellow traders! I've just published a new indicator called the True Range Oscillator. It's designed to help you better understand price movements and volatility. The indicator calculates the average true range of the price data and uses a modified z-score-like approach to normalize it. The main difference is that it uses true range instead of standard deviation for normalization.
This oscillator identifies the highest and lowest values within a specified range, excluding any outliers based on standard deviations. It then scales the output between 0 and 100, so you can easily see how the current price action compares to its historical range. You can use the True Range Oscillator to spot potential trend reversals and overbought/oversold conditions.
Here are some features to explore:
Customize your price data source (open, high, low, or close).
Adjust the length and smoothing settings for the average true range calculation.
Find outliers with standard deviations, and tweak the outlier_level and dev_lookback options.
Visualize price action with plotted lines for the upper range (70), lower range (30), and center line (50), along with a shaded area between the upper and lower ranges for added clarity.
I hope you find this indicator useful in your trading journey!
Note di rilascio
Fixed smoothingScript open-source
Nello spirito di TradingView, l'autore di questo script lo ha reso open source, in modo che i trader possano esaminarne e verificarne la funzionalità. Complimenti all'autore! Sebbene sia possibile utilizzarlo gratuitamente, ricordiamo che la ripubblicazione del codice è soggetta al nostro Regolamento.
Declinazione di responsabilità
Le informazioni e le pubblicazioni non sono intese come, e non costituiscono, consulenza o raccomandazioni finanziarie, di investimento, di trading o di altro tipo fornite o approvate da TradingView. Per ulteriori informazioni, consultare i Termini di utilizzo.
Script open-source
Nello spirito di TradingView, l'autore di questo script lo ha reso open source, in modo che i trader possano esaminarne e verificarne la funzionalità. Complimenti all'autore! Sebbene sia possibile utilizzarlo gratuitamente, ricordiamo che la ripubblicazione del codice è soggetta al nostro Regolamento.
Declinazione di responsabilità
Le informazioni e le pubblicazioni non sono intese come, e non costituiscono, consulenza o raccomandazioni finanziarie, di investimento, di trading o di altro tipo fornite o approvate da TradingView. Per ulteriori informazioni, consultare i Termini di utilizzo.