INVITE-ONLY SCRIPT
Statistical Volatility° [Pro+] (Joshuuu)
Aggiornato
Introduction:
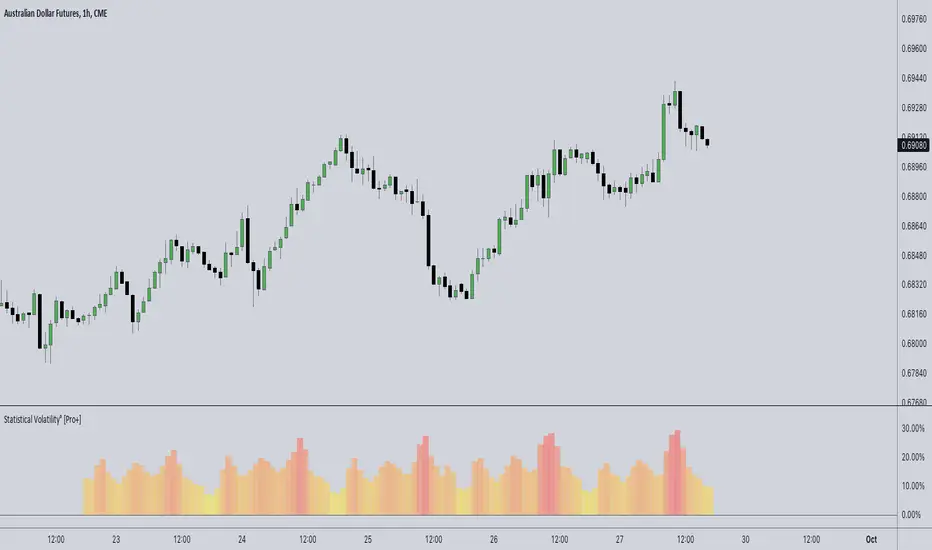
Statistical Volatility is a custom-built indicator designed to help traders track the historical range volatility of each individual candle of a given Timeframe. Compared to traditional volatility metrics, or lookback-based volatility calculations, this indicator is focused on the idea of Time-based volatility.
Description:
Whether you are looking at intraday price movements or weekly trends, this tool provides a clear, visual representation of the average range each candle typically covers. By understanding these volatility patterns, traders can observe when markets are likely to expand or consolidate, based on Time.
To obtain this insightful metrics, all available candle range data is normalized; values are therefore represented as a percentage of the maximum historical Time volatility, indicating how each candle range compares relative to the highest value. This allows for an easy comparison of volatility across different Time periods.
Key Features:
How Traders Can Use Statistical Volatility [Pro+] (Joshuuu) Effectively:
Usage Guidance:
These tools are available ONLY on the TradingView platform.
Terms and Conditions
Statistical Volatility is a custom-built indicator designed to help traders track the historical range volatility of each individual candle of a given Timeframe. Compared to traditional volatility metrics, or lookback-based volatility calculations, this indicator is focused on the idea of Time-based volatility.
Description:
Whether you are looking at intraday price movements or weekly trends, this tool provides a clear, visual representation of the average range each candle typically covers. By understanding these volatility patterns, traders can observe when markets are likely to expand or consolidate, based on Time.
To obtain this insightful metrics, all available candle range data is normalized; values are therefore represented as a percentage of the maximum historical Time volatility, indicating how each candle range compares relative to the highest value. This allows for an easy comparison of volatility across different Time periods.
Key Features:
- Detailed Volatility Tracking: The Statistical Volatility indicator enables traders to track the volatility of each candle throughout the day, week, or month, depending on the selected Timeframe. It helps to identify statistical Times of expansion or consolidation, beyond what current price data may showcase.
- Timeframe Adaptability: On lower timeframes such as the 5 Minute Timeframe, the indicator calculates and plots the statistical range for each 5 Minute candle of the day, respectively. On higher timeframes, such as 1 Hour Timeframe or above, the ranges are plotted for each candle of the week, respectively. This adaptability ensures the indicator is versatile enough for day traders, scalpers, and swing traders alike; maintaining a highly granular yet versatile statistical edge.
- Flexible Display Options: Traders can choose between different visualization methods, in form of a Heatmap or a Barchart, to display the volatility calculations. The heatmap offers a simple visualization of the data, relying entirely on the color gradient to display volatility. On the other hand, the Barchart gives more flexibility to the analyst by providing a more detailed visual analysis, with the ability of overlaying and comparing the current Time-based volatility.
How Traders Can Use Statistical Volatility [Pro+] (Joshuuu) Effectively:
- Data-Based Optimization: By understanding when the market typically experiences its largest or smallest moves, traders can better frame the current narrative. Especially when backtesting, this information can help optimize analysts' entry mechanisms thanks to the introduction of a Time-based statistical component.
- Asset-Specific Insights: Currencies like Forex pairs (i.e.

 EURUSD,
  AUDUSD ) or other Asset Classes tied to a particular geographical location (i.e.
  NQ1! in the United States,
  DAX in Germany), experience volatility spikes during the operational hours of major banks. Each asset has its own “active” Time when liquidity and volatility are higher, tied to when their corresponding markets are open. This makes Statistical Volatility particularly useful for traders who focus on multiple assets across different time zones.
Usage Guidance:
- Add Statistical Volatility [Pro+] (Joshuuu) to your TradingView chart.
- Customize your preferred volatility calculation type, gradient colors, and plot styles.
- Use the volatility graphic to monitor current and upcoming shifts in volatility.
- Incorporate Statistical Volatility [Pro+] (Joshuuu) into your existing statistical strategies to fine-tune your interpretation of market behaviour.
These tools are available ONLY on the TradingView platform.
Terms and Conditions
- Our charting tools are products provided for informational and educational purposes only and do not constitute financial, investment, or trading advice. Our charting tools are not designed to predict market movements or provide specific recommendations. Users should be aware that past performance is not indicative of future results and should not be relied upon for making financial decisions. By using our charting tools, the purchaser agrees that the seller and the creator are not responsible for any decisions made based on the information provided by these charting tools. The purchaser assumes full responsibility and liability for any actions taken and the consequences thereof, including any loss of money or investments that may occur as a result of using these products. Hence, by purchasing these charting tools, the customer accepts and acknowledges that the seller and the creator are not liable nor responsible for any unwanted outcome that arises from the development, the sale, or the use of these products. Finally, the purchaser indemnifies the seller from any and all liability. If the purchaser was invited through the Friends and Family Program, they acknowledge that the provided discount code only applies to the first initial purchase of the Toodegrees Premium Suite subscription. The purchaser is therefore responsible for cancelling – or requesting to cancel – their subscription in the event that they do not wish to continue using the product at full retail price. If the purchaser no longer wishes to use the products, they must unsubscribe from the membership service, if applicable. We hold no reimbursement, refund, or chargeback policy. Once these Terms and Conditions are accepted by the Customer, before purchase, no reimbursements, refunds or chargebacks will be provided under any circumstances.
- By continuing to use these charting tools, the user acknowledges and agrees to the Terms and Conditions outlined in this legal disclaimer.
Note di rilascio
Miscellaneous Bug Fixes (plotting, calculation, logic)Note di rilascio
Minor Bug FixesNote di rilascio
Minor Bug FixesScript su invito
L'accesso a questo script è riservato agli utenti autorizzati dall'autore, solitamente dietro pagamento di una commissione. Puoi aggiungerlo ai preferiti, ma sarai in grado di utilizzarlo solo una volta ricevuto il via libera da parte dell'autore. Per ulteriori informazioni, contatta toodegrees o segui le istruzioni dell'autore riportate di seguito.
TradingView non suggerisce di pagare per uno script e di utilizzarlo a meno che non ci si fidi al 100% del suo autore e non si comprenda il suo funzionamento. In molti casi, è possibile trovare gratuitamente una buona alternativa open-source nei nostri Script della comunità.
Istruzioni dell'autore
″Get access here: https://www.toodegrees.trade/levelup/statisticalmapping
Vuoi usare questo script sui tuoi grafici?
Attenzione: leggi prima di richiedere l'accesso.
homo faber fortunæ suæ
Declinazione di responsabilità
Le informazioni ed i contenuti pubblicati non costituiscono in alcun modo una sollecitazione ad investire o ad operare nei mercati finanziari. Non sono inoltre fornite o supportate da TradingView. Maggiori dettagli nelle Condizioni d'uso.