OPEN-SOURCE SCRIPT
USDT.D + USDT.C ALL TIMEFRAMES
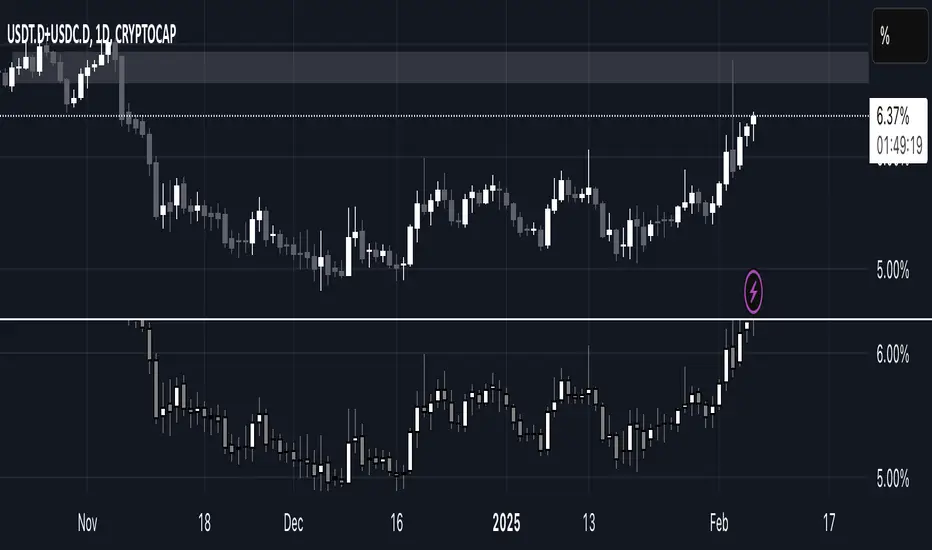
This indicator combines the dominance of USDT (USDT.D) and USDC (USDC.D) to track total stablecoin market share across all timeframes. It displays the combined dominance as candlesticks, providing a clearer view of market liquidity shifts and investor sentiment.
📌 How to Use:
Green candles indicate rising stablecoin dominance (potential risk-off sentiment).
Red candles indicate declining stablecoin dominance (potential risk-on sentiment).
Works on all timeframes, from intraday scalping to macro trend analysis.
This tool is essential for traders looking to analyze stablecoin liquidity flow, identify market turning points, and refine trading strategies based on stablecoin dominance behavior. 🚀
Script open-source
Nello spirito di TradingView, l'autore di questo script lo ha reso open source, in modo che i trader possano esaminarne e verificarne la funzionalità. Complimenti all'autore! Sebbene sia possibile utilizzarlo gratuitamente, ricordiamo che la ripubblicazione del codice è soggetta al nostro Regolamento.
Declinazione di responsabilità
Le informazioni e le pubblicazioni non sono intese come, e non costituiscono, consulenza o raccomandazioni finanziarie, di investimento, di trading o di altro tipo fornite o approvate da TradingView. Per ulteriori informazioni, consultare i Termini di utilizzo.