OPEN-SOURCE SCRIPT
Relative Volatility Mass [SciQua]

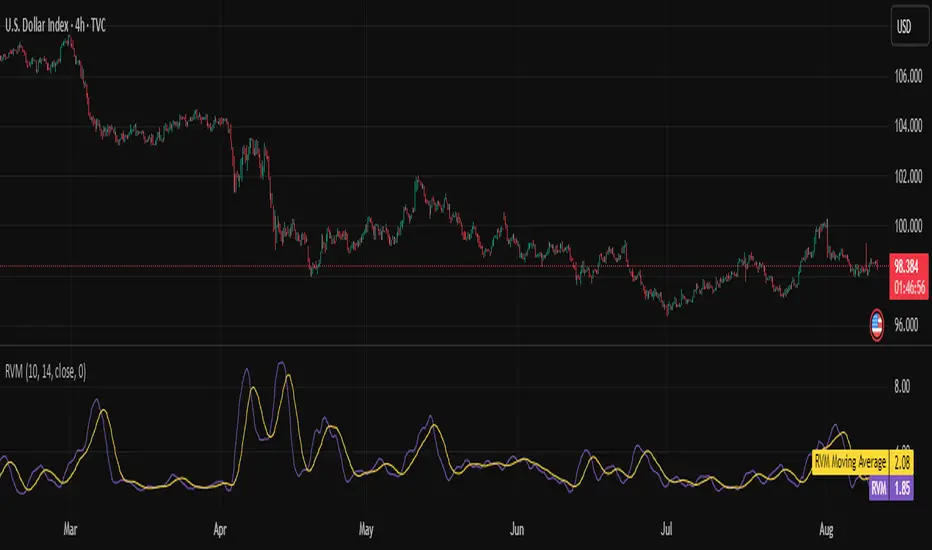
The ⚖️ Relative Volatility Mass (RVM) is a volatility-based tool inspired by the Relative Volatility Index (RVI).
While the RVI measures the ratio of upward to downward volatility over a period, RVM takes a different approach:
This makes RVM particularly useful for identifying sustained high-volatility conditions without being diluted by averaging.
────────────────────────────────────────────────────────────
╭────────────╮
How It Works
╰────────────╯
1. Standard Deviation Calculation
• Computes the standard deviation of the chosen `Source` over a `Standard Deviation Length` (`stdDevLen`).
2. Directional Separation
• Volatility on up bars (`chg > 0`) is treated as upward volatility.
• Volatility on down bars (`chg < 0`) is treated as downward volatility.
3. Rolling Sum
• Over a `Sum Length` (`sumLen`), the upward and downward volatilities are summed separately using `math.sum()`.
4. Relative Volatility Mass
• The two sums are added together to get the total volatility mass for the rolling window.
Formula:
RVM = Σ(σup) + Σ(σdown)
where σ is the standard deviation over `stdDevLen`.
╭────────────╮
Key Features
╰────────────╯
╭─────╮
Usage
╰─────╯
RVM is not bounded like the RVI, so absolute values depend on market volatility and chosen parameters.
Consider normalizing or using smoothing for easier visual comparison.
╭────────────────╮
Example Settings
╰────────────────╯
╭───────────────────╮
Notes & Limitations
╰───────────────────╯
╭───────╮
Credits
╰───────╯
While the RVI measures the ratio of upward to downward volatility over a period, RVM takes a different approach:
- It sums the standard deviation of price changes over a rolling window, separating upward volatility from downward volatility.
- The result is a measure of the total “volatility mass” over a user-defined period, rather than an average or normalized ratio.
This makes RVM particularly useful for identifying sustained high-volatility conditions without being diluted by averaging.
────────────────────────────────────────────────────────────
╭────────────╮
How It Works
╰────────────╯
1. Standard Deviation Calculation
• Computes the standard deviation of the chosen `Source` over a `Standard Deviation Length` (`stdDevLen`).
2. Directional Separation
• Volatility on up bars (`chg > 0`) is treated as upward volatility.
• Volatility on down bars (`chg < 0`) is treated as downward volatility.
3. Rolling Sum
• Over a `Sum Length` (`sumLen`), the upward and downward volatilities are summed separately using `math.sum()`.
4. Relative Volatility Mass
• The two sums are added together to get the total volatility mass for the rolling window.
Formula:
RVM = Σ(σup) + Σ(σdown)
where σ is the standard deviation over `stdDevLen`.
╭────────────╮
Key Features
╰────────────╯
- Directional Volatility Tracking – Differentiates between volatility during price advances vs. declines.
- Rolling Volatility Mass – Shows the total standard deviation accumulation over a given period.
- Optional Smoothing – Multiple MA types, including SMA, EMA, SMMA (RMA), WMA, VWMA.
- Bollinger Band Overlay – Available when SMA is selected, with adjustable standard deviation multiplier.
- Configurable Source – Apply RVM to `close`, `open`, `hl2`, or any custom source.
╭─────╮
Usage
╰─────╯
- Trend Confirmation: High RVM values can confirm strong trending conditions.
- Breakout Detection: Spikes in RVM often precede or accompany price breakouts.
- Volatility Cycle Analysis: Compare periods of contraction and expansion.
RVM is not bounded like the RVI, so absolute values depend on market volatility and chosen parameters.
Consider normalizing or using smoothing for easier visual comparison.
╭────────────────╮
Example Settings
╰────────────────╯
- Short-term volatility detection: `stdDevLen = 5`, `sumLen = 10`
- Medium-term trend volatility: `stdDevLen = 14`, `sumLen = 20`
- Enable `SMA + Bollinger Bands` to visualize when volatility is unusually high or low relative to recent history.
╭───────────────────╮
Notes & Limitations
╰───────────────────╯
- Not a directional signal by itself — use alongside price structure, volume, or other indicators.
- Higher `sumLen` will smooth short-term fluctuations but reduce responsiveness.
- Because it sums, not averages, values will scale with both volatility and chosen window size.
╭───────╮
Credits
╰───────╯
- Based on the Relative Volatility Index concept by Donald Dorsey (1993).
- TradingView
- SciQua - Joshua Danford
Script open-source
Nello spirito di TradingView, l'autore di questo script lo ha reso open source, in modo che i trader possano esaminarne e verificarne la funzionalità. Complimenti all'autore! Sebbene sia possibile utilizzarlo gratuitamente, ricordiamo che la ripubblicazione del codice è soggetta al nostro Regolamento.
🚀 Founder of SciQua | Strategy. Simulation. Signals.
TradingView indicators, backtesting tools, weekly contests, and live market analysis.
Join free, compete, win, and stay updated at sciqua.com
TradingView indicators, backtesting tools, weekly contests, and live market analysis.
Join free, compete, win, and stay updated at sciqua.com
Declinazione di responsabilità
Le informazioni e le pubblicazioni non sono intese come, e non costituiscono, consulenza o raccomandazioni finanziarie, di investimento, di trading o di altro tipo fornite o approvate da TradingView. Per ulteriori informazioni, consultare i Termini di utilizzo.