OPEN-SOURCE SCRIPT
Dashboard Trends
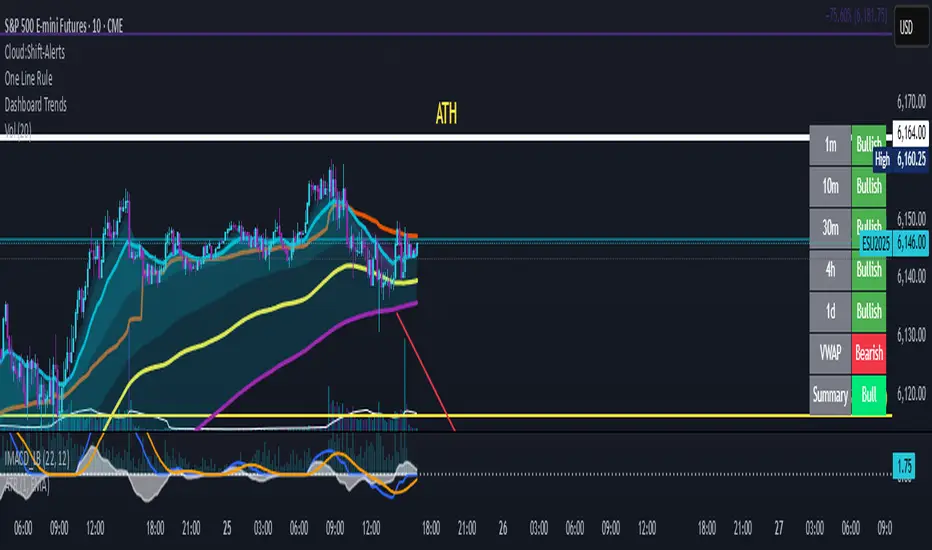
📊 Dashboard Trends + Anchored Daily VWAP
This indicator provides a real-time multi-timeframe trend dashboard alongside a daily anchored VWAP system, helping you assess both macro and intraday market sentiment at a glance.
🔍 Key Features
✅ Multi-Timeframe Trend Analysis
Tracks whether EMA(22) is above EMA(200) across:
1m, 10m, 30m, 4h, 1D timeframes
Color-coded "Bullish"/"Bearish" status for each
Aggregated trend summary using 6 signals (including VWAP)
✅ Anchored Daily VWAP
Uses ta.vwap to provide a session-resetting daily VWAP
VWAP resets at the beginning of each trading day
Live update throughout the day
Supports pre-market and after-hours if chart includes ETH
✅ VWAP Bands (±1σ to ±3σ)
Optional bands show price deviation from VWAP
Fully customizable:
Enable/disable each band
Set deviation multiplier
Adjust color and visibility
✅ Visual Dashboard
Table display in the bottom-right corner
Shows trend status per timeframe + VWAP + Summary
Easy-to-read green/yellow/red color codes
⚙️ Customization
Toggle VWAP line on/off
Enable or disable any band level
Adjust standard deviation multiplier
Choose your VWAP and band colors
🧠 Summary Logic
Strong Bull: 6 bullish signals
Bull: 5 signals
Mixed: 3–4 signals
Bear: 2 signals
Strong Bear: 0–1 signals
This tool is perfect for traders looking to combine trend-following and intraday mean-reversion awareness, with all the critical data visualized in one compact dashboard.
Script open-source
Nello spirito di TradingView, l'autore di questo script lo ha reso open source, in modo che i trader possano esaminarne e verificarne la funzionalità. Complimenti all'autore! Sebbene sia possibile utilizzarlo gratuitamente, ricordiamo che la ripubblicazione del codice è soggetta al nostro Regolamento.
Declinazione di responsabilità
Le informazioni e le pubblicazioni non sono intese come, e non costituiscono, consulenza o raccomandazioni finanziarie, di investimento, di trading o di altro tipo fornite o approvate da TradingView. Per ulteriori informazioni, consultare i Termini di utilizzo.