OPEN-SOURCE SCRIPT
Aggiornato US Yield Curve (2-10yr)
US Yield Curve (2-10yr) by oonoon
2-10Y US Yield Curve and Investment Strategies
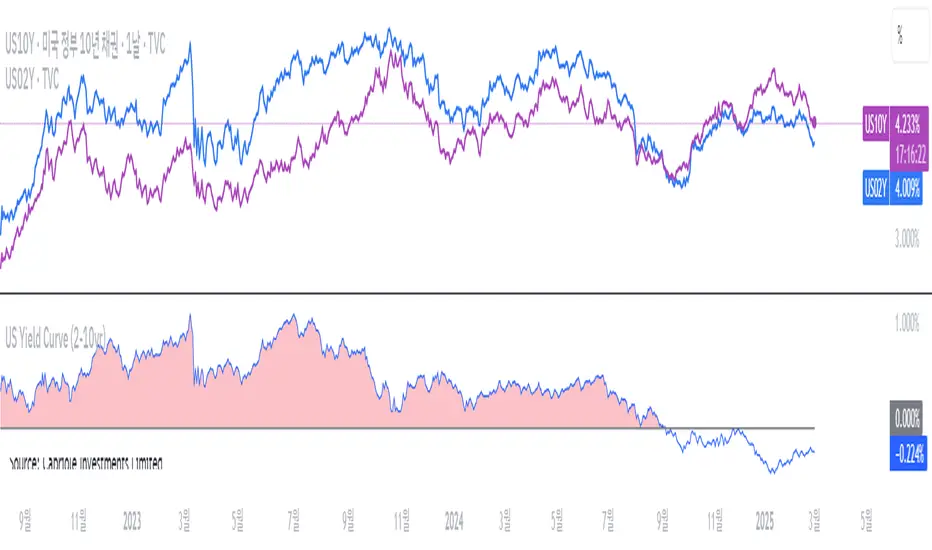
The 2-10 year US Treasury yield spread measures the difference between the 10-year and 2-year Treasury yields. It is a key indicator of economic conditions.
Inversion (Spread < 0%): When the 2-year yield exceeds the 10-year yield, it signals a potential recession. Investors may shift to long-term bonds (TLT, ZROZ), gold (GLD), or defensive stocks.
Steepening (Spread widening): A rising 10-year yield relative to the 2-year suggests economic expansion. Investors can benefit by shorting bonds (TBT) or investing in financial stocks (XLF). The Amundi US Curve Steepening 2-10Y ETF can be used to profit from this trend.
Monitoring the curve: Traders can track US10Y-US02Y on TradingView for real-time insights and adjust portfolios accordingly.
2-10Y US Yield Curve and Investment Strategies
The 2-10 year US Treasury yield spread measures the difference between the 10-year and 2-year Treasury yields. It is a key indicator of economic conditions.
Inversion (Spread < 0%): When the 2-year yield exceeds the 10-year yield, it signals a potential recession. Investors may shift to long-term bonds (TLT, ZROZ), gold (GLD), or defensive stocks.
Steepening (Spread widening): A rising 10-year yield relative to the 2-year suggests economic expansion. Investors can benefit by shorting bonds (TBT) or investing in financial stocks (XLF). The Amundi US Curve Steepening 2-10Y ETF can be used to profit from this trend.
Monitoring the curve: Traders can track US10Y-US02Y on TradingView for real-time insights and adjust portfolios accordingly.
Note di rilascio
2-10Y US Yield Curve and Investment Strategies by oonoonThe 2-10 year US Treasury yield spread measures the difference between the 10-year and 2-year Treasury yields. It is a key indicator of economic conditions.
Inversion (Spread < 0%): When the 2-year yield exceeds the 10-year yield, it signals a potential recession. Investors may shift to long-term bonds (TLT, ZROZ), gold (GLD), or defensive stocks.
Steepening (Spread widening): A rising 10-year yield relative to the 2-year suggests economic expansion. Investors can benefit by shorting bonds (TBT) or investing in financial stocks (XLF). The Amundi US Curve Steepening 2-10Y ETF can be used to profit from this trend.
Monitoring the curve: Traders can track US10Y-US02Y on TradingView for real-time insights and adjust portfolios accordingly.
Script open-source
Nello spirito di TradingView, l'autore di questo script lo ha reso open source, in modo che i trader possano esaminarne e verificarne la funzionalità. Complimenti all'autore! Sebbene sia possibile utilizzarlo gratuitamente, ricordiamo che la ripubblicazione del codice è soggetta al nostro Regolamento.
Declinazione di responsabilità
Le informazioni e le pubblicazioni non sono intese come, e non costituiscono, consulenza o raccomandazioni finanziarie, di investimento, di trading o di altro tipo fornite o approvate da TradingView. Per ulteriori informazioni, consultare i Termini di utilizzo.