OPEN-SOURCE SCRIPT
Aggiornato DTR vs ATR w RVol

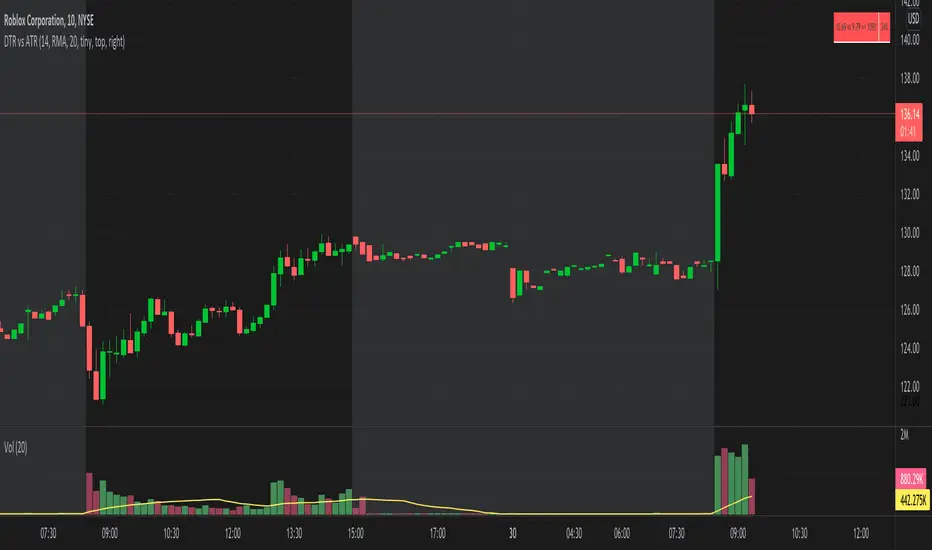
DTR vs ART along with Relative Volume in Percentage. So if you see RVol as 200% with input length of 10 days, today's volume is 2x compared to past 10 days. It helps if today's volume is already reached 20% or 30% within 30mins of market open, etc.
Note di rilascio
Added an option to choose Smoothing for ATRNote di rilascio
Updated some notesNote di rilascio
Updating function to work betterNote di rilascio
cleaning up stuffNote di rilascio
There was a mis-calculation on the script where if you change chart resolution, the RVol changes. But the intention of this script is, both DTR vs ATR value and RVol should be same for the day whether you're on 1Hr chart or 3min chart or Daily chart. The idea is, we want to see what is today's DTR vs ATR and what is today's Relative Volume. Note di rilascio
Update Notes: Couple of features added:
1. When chart resolution is Daily or Intraday (D, 4H, 1H, 5min, etc), both True Range and Relative Volume shows value based on DAILY.
2. When resolution is changed to Weekly or Monthly, then both True Range and Relative Volume shows corresponding value. i.e. Weekly shows weekly true range vs past 'N' weekly ATR. Weekly Relative Volume shows relative volume of this week compared to past 'N' weeks. Likewise for Monthly. You would see change in label name. Like, Weekly chart shows WTR (Weekly True Range) and W_RVol (Weekly Relative Volume). Likewise, Daily & Intraday shows DTR & D_RVol. Monthly shows MTR (Monthly True Range) and M_RVol (Monthly Relative Volume).
3. Added a plot (by default hidden) for this specific reason: When you move the cursor to focus specific candle, then Indicator Value displays relative volume of that specific candle. This applies to Intraday as well. So if you're in 1HR chart and move the cursor to a specific candle, Indicator Value shows relative volume for that specific candlestick bar.
Hope you find this useful.
Note di rilascio
Introducing Table with this release. Here are the features:1. You can choose location of the panel/table from settings
2. You can choose to hide table Header
If you still like to use older version (label), I think you can still change to previous version of this script.
Hope this helps with multiple charts layout as well.
Note di rilascio
Per request from my followers, I have updated this script so that you can choose location of the table and text size. In addition to that, you can enable/disable table title.Here is the supported text size: "auto", "tiny", "small", "normal", "large", "huge"
Script open-source
Nello spirito di TradingView, l'autore di questo script lo ha reso open source, in modo che i trader possano esaminarne e verificarne la funzionalità. Complimenti all'autore! Sebbene sia possibile utilizzarlo gratuitamente, ricordiamo che la ripubblicazione del codice è soggetta al nostro Regolamento.
Declinazione di responsabilità
Le informazioni e le pubblicazioni non sono intese come, e non costituiscono, consulenza o raccomandazioni finanziarie, di investimento, di trading o di altro tipo fornite o approvate da TradingView. Per ulteriori informazioni, consultare i Termini di utilizzo.