OPEN-SOURCE SCRIPT
Similar Price Action
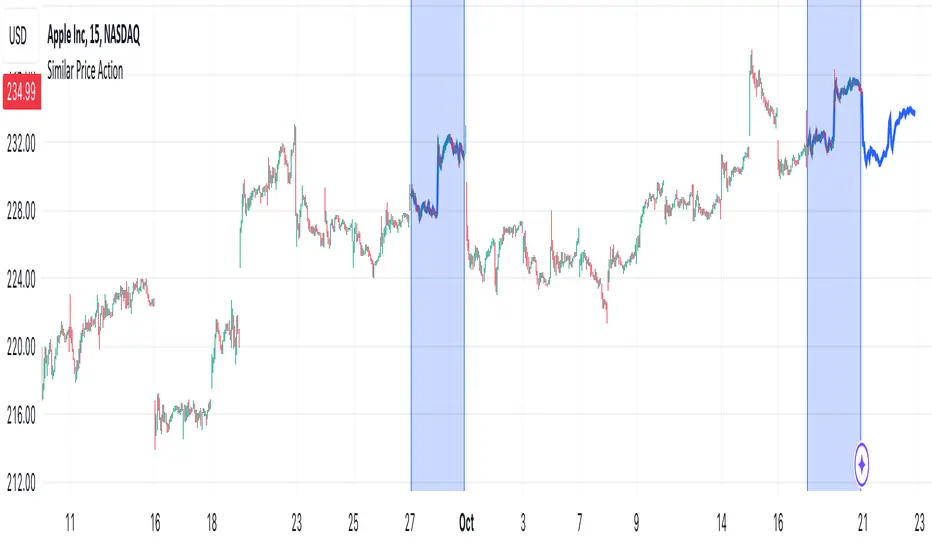
Description:
The indicator tries to find an area of N candles in history that has the most similar price action to the latest N candles. The maximum search distance is limited to 5000 candles. It works by calculating a coefficient for each candle and comparing it with the coefficient of the latest candle, thus searching for two closest values. The indicator highlights the latest N candles, as well as the most similar area found in the past, and also tries to predict future price based on the latest price and price directly after the most similar area that was found in the past.
Inputs:
- Length -> the area we are searching for is comprised of this many candles
- Lookback -> maximum distance in which a similar area can be found
- Function -> the function used to compare latest and past prices
Notes:
- The indicator is intended to work on smaller timeframes where the overall price difference is not very high, but can be used on any
Script open-source
Nello spirito di TradingView, l'autore di questo script lo ha reso open source, in modo che i trader possano esaminarne e verificarne la funzionalità. Complimenti all'autore! Sebbene sia possibile utilizzarlo gratuitamente, ricordiamo che la ripubblicazione del codice è soggetta al nostro Regolamento.
Declinazione di responsabilità
Le informazioni e le pubblicazioni non sono intese come, e non costituiscono, consulenza o raccomandazioni finanziarie, di investimento, di trading o di altro tipo fornite o approvate da TradingView. Per ulteriori informazioni, consultare i Termini di utilizzo.