OPEN-SOURCE SCRIPT
💸 Monetary Momentum Oscillator (MMO)
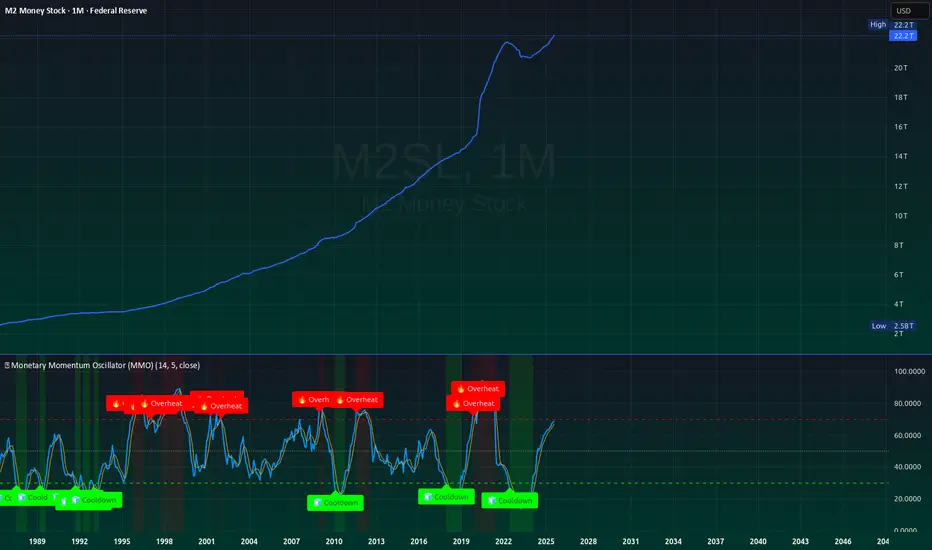
Monetary Momentum Oscillator (MMO)
The Monetary Momentum Oscillator (MMO) measures the rate of change in the money supply (like M2, Fed Balance Sheet, or similar macro series) and applies a momentum-based RSI calculation to visualize liquidity acceleration and deceleration.
💡 Purpose:
MMO is designed for macro-level analysis — it identifies when monetary expansion is overheating (potential inflation or risk-on conditions) and when contraction is cooling off (liquidity tightening or deflationary stress).
📊 How It Works:
Calculates the percentage change of the selected data source over a chosen lookback period.
Applies an RSI transformation to visualize momentum extremes.
Overlays signal smoothing and highlights overheat/cooldown zones.
🔍 Interpretation:
Above 70 → Liquidity acceleration / overheating (potential inflationary impulse).
Below 30 → Liquidity deceleration / contraction (risk-off, tightening).
Crossovers → Momentum shifts that often precede macro trend reversals in risk assets.
⚙️ Best Used On:
Macroeconomic series such as M2SL, M2V, WALCL, or custom liquidity indexes.
Long-term charts (weekly or monthly) for detecting major monetary regime transitions.
🧩 Core Idea:
Liquidity is the real market engine — this oscillator quantifies its pulse.
Script open-source
In pieno spirito TradingView, il creatore di questo script lo ha reso open-source, in modo che i trader possano esaminarlo e verificarne la funzionalità. Complimenti all'autore! Sebbene sia possibile utilizzarlo gratuitamente, ricorda che la ripubblicazione del codice è soggetta al nostro Regolamento.
Declinazione di responsabilità
Le informazioni ed i contenuti pubblicati non costituiscono in alcun modo una sollecitazione ad investire o ad operare nei mercati finanziari. Non sono inoltre fornite o supportate da TradingView. Maggiori dettagli nelle Condizioni d'uso.