OPEN-SOURCE SCRIPT
Aggiornato Consolidation VWAP's [QuantVue]
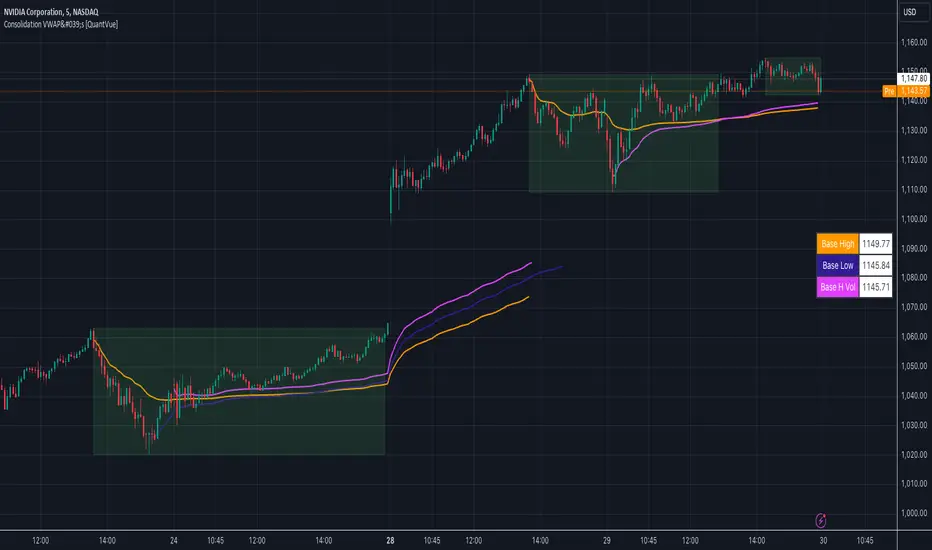
Introducing the Consolidation VWAP's Indicator, a powerful tool designed to identify consolidation periods in stock advance and automatically anchor three distinct VWAPs to key points within the consolidation.
Consolidation Period Identification:
The indicator automatically detects periods of consolidation or areas on the chart where a stock's price moves sideways within a defined range. This period can be seen as the market taking a "breather" as it digests the previous gains. Consolidations are important because they often act as a base for the next move, either continuing the previous uptrend or reversing direction.
Consolidation requirements can be customized by the user to match your instrument and timeframe.

Anchored VWAP, or Anchored Volume-Weighted Average Price, is a technical analysis tool used to determine the average price of a stock weighted by volume, starting from a specific point in time chosen by the analyst.
Unlike traditional VWAP, which starts at the beginning of the trading session, the anchored VWAP allows traders to select any point on the chart, such as a significant event, price low, high, or a breakout, to begin the calculation.
VWAP incorporates price and volume in a weighted average and can be used to identify areas of support and resistance on the chart.
VWAP Anchored to Consolidation High: This VWAP is anchored at the highest price point within the identified consolidation period. It helps traders understand the
average price paid by buyers who entered at the peak of the consolidation.
VWAP Anchored to Consolidation Low: This VWAP is anchored at the lowest price point within the consolidation. It provides insights into the average price paid by
buyers who entered at the lowest point of the consolidation.
VWAP Anchored to Highest Volume in the Consolidation: This VWAP is anchored at the price level with the highest trading volume during the consolidation. It reflects the average price at
which the most trading activity occurred, often indicating a key support or resistance level.

The indicator also allows the trader to see past consolidation areas and previous anchored VWAP's.

Give this indicator a BOOST and COMMENT your thoughts!
We hope you enjoy.
Cheers!
Consolidation Period Identification:
The indicator automatically detects periods of consolidation or areas on the chart where a stock's price moves sideways within a defined range. This period can be seen as the market taking a "breather" as it digests the previous gains. Consolidations are important because they often act as a base for the next move, either continuing the previous uptrend or reversing direction.
Consolidation requirements can be customized by the user to match your instrument and timeframe.
- Maximum Consolidation Depth
- Minimum Consolidation Length
- Maximum Consolidation Length
- Prior Uptrend Amount
Anchored VWAP, or Anchored Volume-Weighted Average Price, is a technical analysis tool used to determine the average price of a stock weighted by volume, starting from a specific point in time chosen by the analyst.
Unlike traditional VWAP, which starts at the beginning of the trading session, the anchored VWAP allows traders to select any point on the chart, such as a significant event, price low, high, or a breakout, to begin the calculation.
VWAP incorporates price and volume in a weighted average and can be used to identify areas of support and resistance on the chart.
VWAP Anchored to Consolidation High: This VWAP is anchored at the highest price point within the identified consolidation period. It helps traders understand the
average price paid by buyers who entered at the peak of the consolidation.
VWAP Anchored to Consolidation Low: This VWAP is anchored at the lowest price point within the consolidation. It provides insights into the average price paid by
buyers who entered at the lowest point of the consolidation.
VWAP Anchored to Highest Volume in the Consolidation: This VWAP is anchored at the price level with the highest trading volume during the consolidation. It reflects the average price at
which the most trading activity occurred, often indicating a key support or resistance level.
The indicator also allows the trader to see past consolidation areas and previous anchored VWAP's.
Give this indicator a BOOST and COMMENT your thoughts!
We hope you enjoy.
Cheers!
Note di rilascio
Updated default settings.Script open-source
Nello spirito di TradingView, l'autore di questo script lo ha reso open source, in modo che i trader possano esaminarne e verificarne la funzionalità. Complimenti all'autore! Sebbene sia possibile utilizzarlo gratuitamente, ricordiamo che la ripubblicazione del codice è soggetta al nostro Regolamento.
Get Access to the exclusive QuantVue indicators: quantvue.io/
Join thousands of traders in our Free Discord: discord.gg/tC7u7magU3
Join thousands of traders in our Free Discord: discord.gg/tC7u7magU3
Declinazione di responsabilità
Le informazioni e le pubblicazioni non sono intese come, e non costituiscono, consulenza o raccomandazioni finanziarie, di investimento, di trading o di altro tipo fornite o approvate da TradingView. Per ulteriori informazioni, consultare i Termini di utilizzo.
Script open-source
Nello spirito di TradingView, l'autore di questo script lo ha reso open source, in modo che i trader possano esaminarne e verificarne la funzionalità. Complimenti all'autore! Sebbene sia possibile utilizzarlo gratuitamente, ricordiamo che la ripubblicazione del codice è soggetta al nostro Regolamento.
Get Access to the exclusive QuantVue indicators: quantvue.io/
Join thousands of traders in our Free Discord: discord.gg/tC7u7magU3
Join thousands of traders in our Free Discord: discord.gg/tC7u7magU3
Declinazione di responsabilità
Le informazioni e le pubblicazioni non sono intese come, e non costituiscono, consulenza o raccomandazioni finanziarie, di investimento, di trading o di altro tipo fornite o approvate da TradingView. Per ulteriori informazioni, consultare i Termini di utilizzo.