OPEN-SOURCE SCRIPT
Overbought & Oversold Tracker
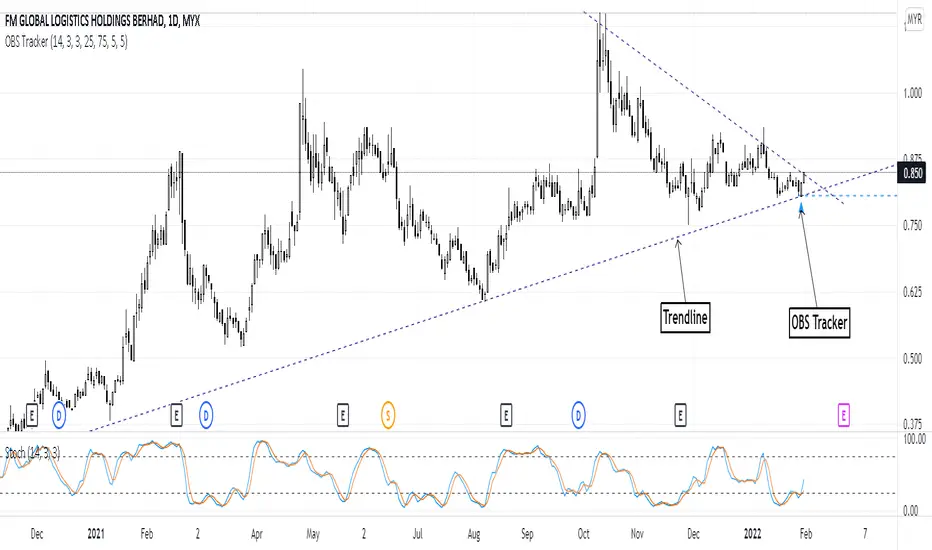
About this indicator:
- This indicator is basically a stochastic indicator that shows to you the crossover in an Overbought or Oversold area DIRECTLY on the chart
How does it works:
- When Stochastic crosses at Oversold area, a Blue Triangle will appear below the candle with a Blue Dotted Line at the low of the current candle
- The Blue Triangle is to help you to see easily the candle where the crossover is occurring
- At the same time, the Blue Dotted Line will act as a minor Support for the current price
- If the current candle breaks the Blue Dotted Line (minor Support), the candle will be displayed in a red color
- Same things will occur if Stochastic crosses at the Overbought area, but at this time, a Red Triangle with Red Dotted Line will appear just to differentiate between Overbought and Oversold crossover
The advantage of using this indicator:
- You can easily see the point of stochastic crossover DIRECTLY on the chart without analyzing the stochastic indicator
- At the same time, it helps you to see clearly either the price is at the bottom / reversal by combining it with S&R / trendlines or other indicators
Personally, I will combine this indicator with:
a. Support and Resistance or Trendlines
b. Fibonacci retracement
c. Candlestick indicator (see my script list)
d. Ultimate MACD (see my script list)
e. Volume indicator
These combinations personally increase the possibility for me to buy exactly at the point of reversal in a pullback
- This indicator is preset at the value of 25 (oversold) and 75 (overbought) k line, it's my own preference. You can change these values at the setting menu to suit your trading style.
- Once again, I am opening the script for anyone to modify/alter it based on you own preference. Have a good day!
Script open-source
Nello spirito di TradingView, l'autore di questo script lo ha reso open source, in modo che i trader possano esaminarne e verificarne la funzionalità. Complimenti all'autore! Sebbene sia possibile utilizzarlo gratuitamente, ricordiamo che la ripubblicazione del codice è soggetta al nostro Regolamento.
Declinazione di responsabilità
Le informazioni e le pubblicazioni non sono intese come, e non costituiscono, consulenza o raccomandazioni finanziarie, di investimento, di trading o di altro tipo fornite o approvate da TradingView. Per ulteriori informazioni, consultare i Termini di utilizzo.