INVITE-ONLY SCRIPT
Asset Correlation with XAU/USD (Macroeconomics X Gold)

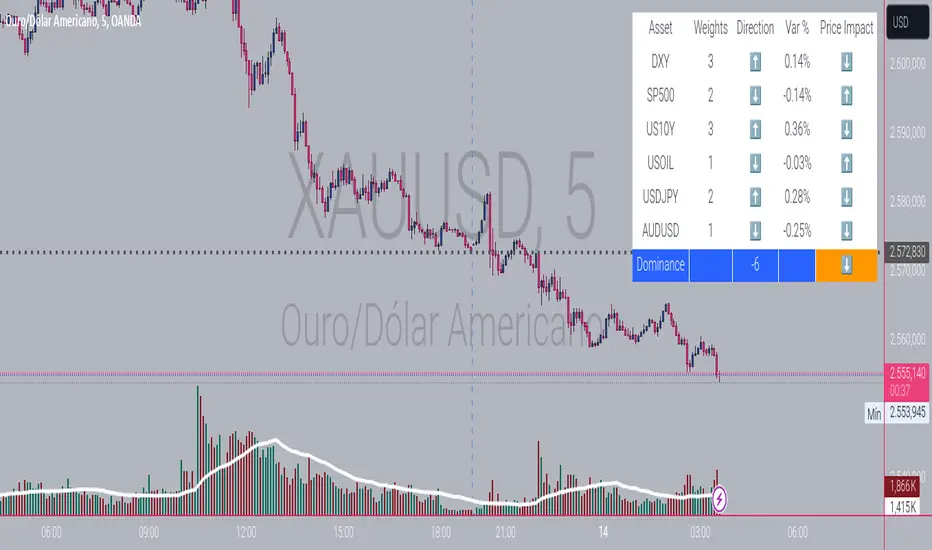
This Pine Script calculates the correlation of economic assets with gold (XAU/USD), including indicators such as the DXY, the S&P 500, the US 10-year yield (US10Y), oil (USOIL), the USD/JPY pair, and the AUD/USD pair. The goal is to analyze the impact of these variables on the price of gold, particularly in a macroeconomic context.
Main Features:
Asset Monitoring: The script monitors 24-hour variations of six key assets (DXY, S&P 500, US10Y, USOIL, USDJPY, AUDUSD), along with the price of XAU/USD.
Percentage Change Calculation: The percentage change for each asset is calculated based on the previous day's close, compared to the most recent 5-minute close.
Direction Determination: The direction of each asset (whether the change is positive, negative, or neutral) is calculated and used to determine the potential impact on the price of gold.
Interactive Tables: The results of directions, variations, and impacts are displayed in a table on the screen, with each asset being evaluated by its weight (influence on gold) and direction. The table also includes arrows indicating the impact of each asset on the price of gold, based on the correlation between them.
Dominance: The overall dominance of gold is calculated based on the weights and directions of the assets, generating a result that reflects whether gold is trending upwards or downwards due to the other observed assets. An arrow symbol indicates whether the dominance is positive (⬆️), negative (⬇️), or neutral (—).
Table Details:
The table displays the monitored assets, their assigned weights, the direction (arrows up, down, or neutral), the percentage change of each asset, and the impact of these assets on the price of gold.
The last column shows the "dominance" overall, with the final impact of these assets on the direction of the XAU/USD price.
Usage: This script is useful for traders and analysts who want to monitor how different macroeconomic factors (such as the value of the dollar, the S&P 500, US interest rates, oil prices, and currency pairs) influence the price of gold. It provides a clear view of how these assets correlate with gold, helping to make more informed decisions in the market.
For a better view of the table, right-click on >> visual order >> bring it to the top.
Script su invito
L'accesso a questo script è riservato agli utenti autorizzati dall'autore, solitamente dietro pagamento di una commissione. Puoi aggiungerlo ai preferiti, ma sarai in grado di utilizzarlo solo una volta ricevuto il via libera da parte dell'autore. Per ulteriori informazioni, contatta Norrax o segui le istruzioni dell'autore riportate di seguito.
TradingView non suggerisce di pagare per uno script e di utilizzarlo a meno che non ci si fidi al 100% del suo autore e non si comprenda il suo funzionamento. In molti casi, è possibile trovare gratuitamente una buona alternativa open-source nei nostri Script della comunità.
Vuoi usare questo script sui tuoi grafici?
Attenzione: leggi prima di richiedere l'accesso.
As a developer, my goal is to contribute to the community by creating solutions that promote collective growth. I believe in collaboration and knowledge sharing for continuous learning and innovation.
Declinazione di responsabilità
Le informazioni ed i contenuti pubblicati non costituiscono in alcun modo una sollecitazione ad investire o ad operare nei mercati finanziari. Non sono inoltre fornite o supportate da TradingView. Maggiori dettagli nelle Condizioni d'uso.