OPEN-SOURCE SCRIPT
SMA Multi Time Frame Table V1.5
Since I couldn't find a script like this I made one so here is what it does.
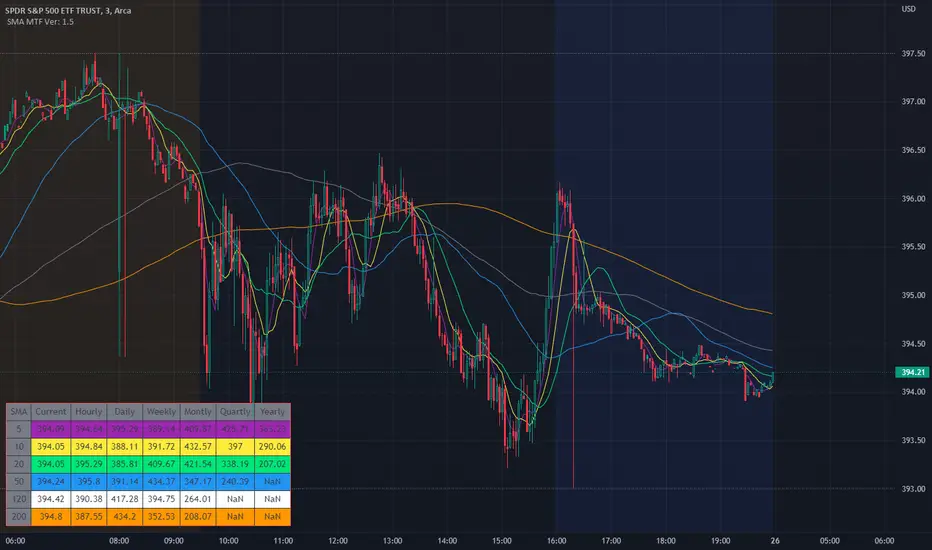
The script will plot on the chart as well as post the related data into the table.
The default Simple Moving Avg are 5, 10, 20, 50, 120, 200 which can also be changed to whatever SMA you would like. The SMA values are then plotted on the charts so that quickly check to see where they are and how the candles are reacting to the SMAs.
Not only does the script plot the SMAs but it also places higher time frames into the table that is in the script, from current price, to daily, weekly, monthly, quarterly (3 months if you don't have it added) and yearly. The reason why was it price action of the stock does interact and can be rejected or find support from SMA on a higher time frames.
I still use this script so that you can quickly capture the values so that short-term, and long-term resistance and support can be determined during market hours.
Another good thing is that when you change the values in the script settings it also applies those settings to the table as well.
Now it will take a little bit for the table to show up, so please be patient. I have tested it with stocks, forex, and crypto.
I wanted to get this published and I am still working on the background to try and get EMAs. Where you can flip over to EMA to also see the EMA plots and table values for the MTF.
Script open-source
Nello spirito di TradingView, l'autore di questo script lo ha reso open source, in modo che i trader possano esaminarne e verificarne la funzionalità. Complimenti all'autore! Sebbene sia possibile utilizzarlo gratuitamente, ricordiamo che la ripubblicazione del codice è soggetta al nostro Regolamento.
Declinazione di responsabilità
Le informazioni e le pubblicazioni non sono intese come, e non costituiscono, consulenza o raccomandazioni finanziarie, di investimento, di trading o di altro tipo fornite o approvate da TradingView. Per ulteriori informazioni, consultare i Termini di utilizzo.