OPEN-SOURCE SCRIPT
VolSum

Google Translation------------------------------------------------------------------------------------------------------------------------------------------
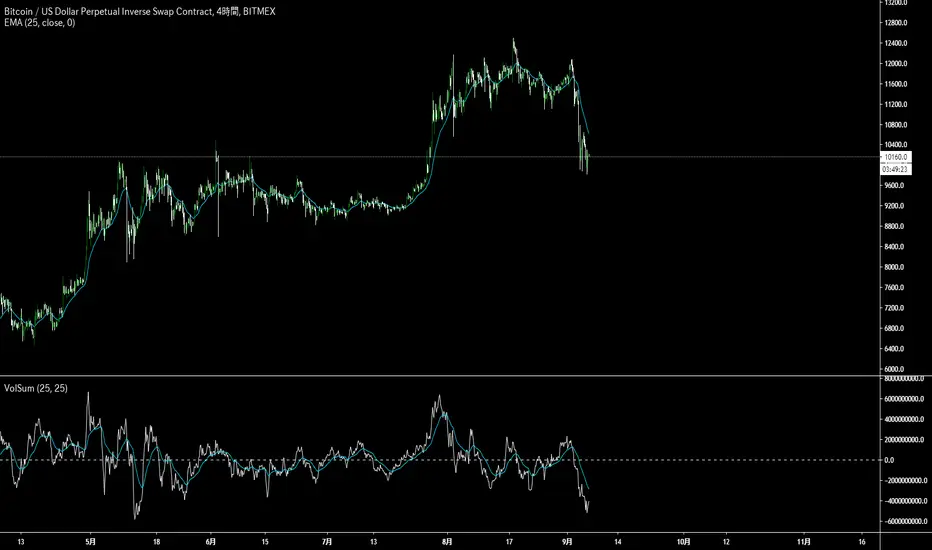
If the closing price is higher than the opening price, the volume is positive and reverse.
If the closing price is smaller than the opening price, the volume is negative and their defined period
It is an indicator that I thought that I would like to see how the shape changes compared to the price chart
when the sum of is calculated.
The white line is the sum of the output and the light blue line is the white line ema.
日本語---------------------------------------------------------------------------------------------------------------------------------------------------------
終値が始値より大きければ出来高をプラスに逆である終値が始値より小さければ出来高をマイナスにしそれらの定められた期間
の合計(sum)を出したら価格チャートと比較して形がどのように変化するか見てみたいと思い作ったインジケーターです。
白い線が出来高のsumで水色の線は白い線のemaになります。
Script open-source
Nello spirito di TradingView, l'autore di questo script lo ha reso open source, in modo che i trader possano esaminarne e verificarne la funzionalità. Complimenti all'autore! Sebbene sia possibile utilizzarlo gratuitamente, ricordiamo che la ripubblicazione del codice è soggetta al nostro Regolamento.
Declinazione di responsabilità
Le informazioni e le pubblicazioni non sono intese come, e non costituiscono, consulenza o raccomandazioni finanziarie, di investimento, di trading o di altro tipo fornite o approvate da TradingView. Per ulteriori informazioni, consultare i Termini di utilizzo.