OPEN-SOURCE SCRIPT
True Strength Index
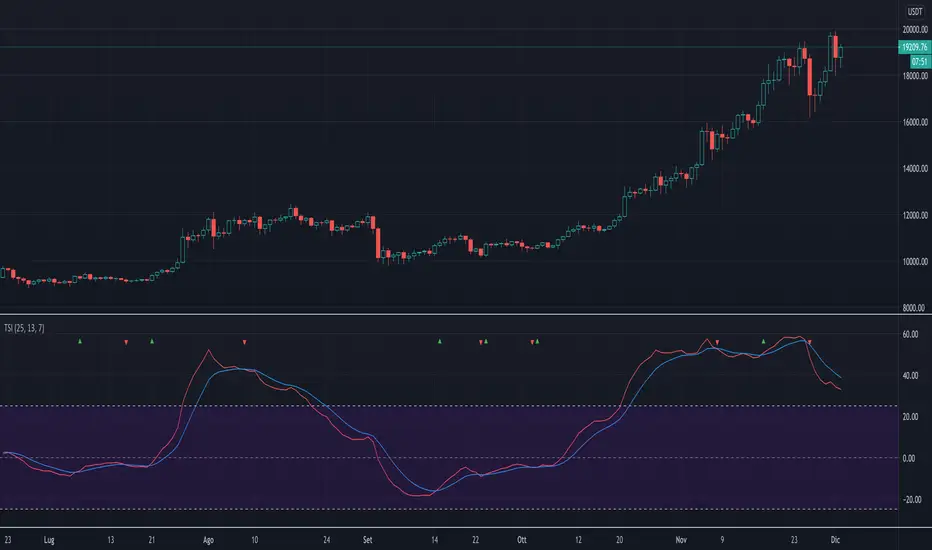
The script implements a custom version of TSI (True Strength Index). This index may be useful for determining overbought and oversold conditions, indicating potential trend direction changes via centerline or signal line crossovers, and warning of trend weakness through divergence.
The script highlights when TSI line crosses the signal line with a colored triangle, that is
Note: Signal line crossovers occur frequently, so should be utilized only in conjunction with other signals from the TSI.
The script is very easy to use and it is possible to change the following parameters:
The script highlights when TSI line crosses the signal line with a colored triangle, that is
- when the TSI line crosses above the signal line from below, that may warrant buying, a green triangle that's pointing up is drawned;
- when the TSI line crosses below the signal line from above, that may warrant selling, a red triangle that's pointing down is drawned.
Note: Signal line crossovers occur frequently, so should be utilized only in conjunction with other signals from the TSI.
The script is very easy to use and it is possible to change the following parameters:
- EMA smoothing period for momentum (default value is 25)
- EMA smoothing period for smoothed momentum (default value is 13)
- Signal line period (default value is 7)
- The type of signal line: EMA or SMA (default value is EMA)
- Show or not the TSI line
- Show or not the signal line
Script open-source
In pieno spirito TradingView, il creatore di questo script lo ha reso open-source, in modo che i trader possano esaminarlo e verificarne la funzionalità. Complimenti all'autore! Sebbene sia possibile utilizzarlo gratuitamente, ricorda che la ripubblicazione del codice è soggetta al nostro Regolamento.
Declinazione di responsabilità
Le informazioni ed i contenuti pubblicati non costituiscono in alcun modo una sollecitazione ad investire o ad operare nei mercati finanziari. Non sono inoltre fornite o supportate da TradingView. Maggiori dettagli nelle Condizioni d'uso.