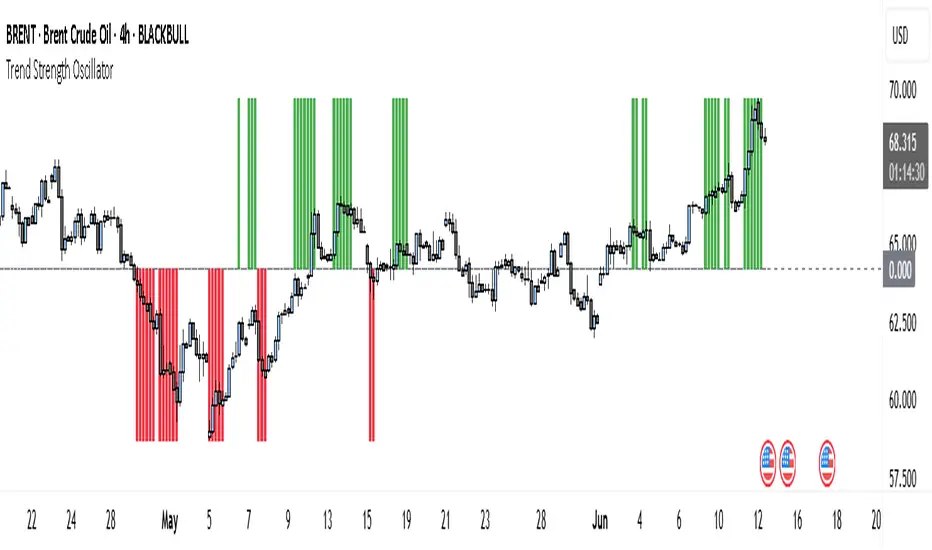
Trend Strength Oscillator📌 What Is the Trend Strength Oscillator?
The Trend Strength Oscillator is a visual tool that helps traders understand the overall direction and strength of the market trend. Instead of using multiple indicators separately, this tool combines three trusted methods into one clear, color-coded bar chart. The bars change based on whether the market is strongly trending up, down, or just moving sideways.
Imagine it as a traffic light for trading:
• Green means it’s safe to consider buying (strong uptrend).
• Red means consider selling or avoiding longs (strong downtrend).
• Gray means wait, the market isn’t clearly trending.
🧠 How It Works — The 3 Main Components
1. EMA Slope
The EMA (Exponential Moving Average) tracks the average price but reacts more quickly to changes. If the EMA is rising, it means the market is likely moving upward. If it’s falling, the trend is likely downward.
2. RSI Direction
RSI (Relative Strength Index) measures momentum. This tool compares the RSI to its smoothed average. If the RSI is above its average, momentum is up. If it’s below, momentum is down.
3. ADX Strength
ADX (Average Directional Index) measures how strong a trend is, not the direction. So even if EMA and RSI agree on a trend, the ADX must confirm it’s strong enough to be worth trading.
Only when all three indicators agree do we consider it a strong trend.
🧮 What the Oscillator Shows
The result of combining those components is a number that becomes a colored bar:
• +2 means all three signals are bullish → green bar.
• -2 means all three signals are bearish → red bar.
• Anything else (e.g., mixed signals or weak ADX) → gray bar.
This makes the chart super easy to read at a glance, even for beginners.
📈 How to Use It in Trading
You can use the Trend Strength Oscillator in a few simple ways:
• Entering Trades:
Look for a green bar when you want to buy or go long. Look for a red bar when you want to sell or go short. These bars mean all systems are “go” in the same direction.
• Avoiding Mistakes:
If the bar is gray, it’s a warning that the market is undecided or weak. It’s often better to wait for a clearer signal rather than force a trade.
• Managing Existing Trades:
If you’re in a trade and the bar color shifts back to gray, that can be a clue that the trend is losing strength. You might tighten your stop-loss or take some profit.
🧭 Final Thoughts
This indicator doesn’t give you a trade entry every few minutes. Instead, it helps you stay on the right side of strong moves and avoid choppy or sideways markets. It’s especially helpful for:
• Trend-following traders
• People who want clean, simple visuals
• Beginners who get overwhelmed with too many indicators
Let me know if you'd like to see this paired with another tool like volume or MACD, or if you’d like a chart screenshot to visualize how this looks live.
True Strength Index (TSI)
BK AK-Scope🔭 Introducing BK AK-Scope — Target Locked. Signal Acquired. 🔭
After building five precision weapons for traders, I’m proud to unveil the sixth.
BK AK-Scope — the eye of the arsenal.
This is not just an indicator. It’s an intelligence system for volatility, signal clarity, and rate-of-change dynamics — forged for elite vision in any market terrain.
🧠 Why “Scope”? And Why “AK”?
Every shooter knows: you can’t hit what you can’t see.
The Scope brings range, clarity, and target distinction. It filters motion from noise. Purpose from panic.
“AK” continues to honor the man who trained my sight — my mentor, A.K.
His discipline taught me to wait for alignment. To move with reason, not emotion.
His vision lives in every code line here.
🔬 What Is BK AK-Scope?
A Triple-Tier TSI Correlation Engine, fused with adaptive opacity logic, a volatility scoring system, and real-time signal clarity. It’s momentum dissected — by speed, depth, and rate of change.
Built to serve traders who:
Need visual hierarchy between fast, mid, and slow TSI responses.
Want adaptive fills that pulse with volatility — not static zones.
Require a volatility scoring overlay that reads the battlefield in real time.
⚙️ Core Systems: How BK AK-Scope Works
✅ Fast/Mid/Slow TSI →
Three layers of correlation: like scopes with zoom levels.
You track micro moves, mid swings, and macro flow simultaneously.
✅ Rate-of-Change Adaptive Opacity →
Momentum fills fade or flash based on speed — giving you movement density at a glance.
Bull vs. Bear zones adapt to strength. You feel the market’s pulse.
✅ Volatility Score Intelligence →
Custom algorithm measuring:
Range expansion
Rate-of-change differentials
ATR dynamics
Standard deviation pressure
All combined into a score from 0–100 with live icons:
🔥 = Extreme Heat (70+)
🧊 = Cold Zone (<30)
⚠️ = ROC Warning
• = Neutral drift
✅ Auto-Detect Volatility Modes →
Scalp = <15min
Swing = intraday/hourly
Macro = daily/weekly
Or override manually with total control.
🎯 How To Use BK AK-Scope
🔹 Trend Continuation → When all three TSI layers align in direction + volatility score climbs, ride with the trend.
🔹 Early Reversals → Opposing TSI + rapid opacity change + volatility shift = sniper reversal zone.
🔹 Consolidation Filter → Neutral fills + score < 30 = stay out, wait for signal surge.
🔹 Signal Confluence → Pair with:
• Gann fans or angles
• Fib time/price clusters
• Elliott Wave structure
• Harmonics or divergence
To isolate entry perfection.
🛡️ Why This Indicator Changes the Game
It's not just momentum. It’s TSI with depth hierarchy.
It’s not just color. It’s real-time strength visualization.
It’s not just volatility. It’s rate-weighted market intelligence.
This is market optics for the advanced trader — built for vision, clarity, and discipline.
🙏 Final Thoughts
🔹 In honor of A.K., my mentor. The man who taught me to see what others miss.
🔹 Inspired by the power of vision — because execution without clarity is chaos.
🔹 Powered by faith — because Gd alone gives sight beyond the visible.
“He gives sight to the blind and wisdom to the humble.” — Psalms 146
Every tool I build is a prayer in code — that it helps someone trade with clarity, integrity, and precision.
⚡ Zoom In. Focus Deep. Trade Clean.
BK AK-Scope — Lock on the target. See what others don’t.
🔫 Clarity is power. 🔫
Gd bless. 🙏
Sentiment Master Oscillator[BullByte]
The Sentiment Master Oscillator is a modern market sentiment indicator designed for traders seeking to identify early trend shifts and potential reversals with clarity. This oscillator combines multiple technical tools—RSI, MACD, EMAs, ADX, ATR, and volume filters—to deliver layered signals that help you assess market momentum in a clear and simplified manner.
Key Features:
- Multi-Indicator Approach :
Integrates RSI (with a smoothing function), MACD, and two EMAs to gauge momentum and trend direction. The oscillator also includes ADX and ATR filters to ensure that only markets with sufficient directional strength and volatility generate signals.
- Dynamic Signal Zones :
The oscillator produces a raw value ranging roughly from -3 to +3 (adjustable via a scaling factor). Positive readings suggest bullish conditions, while negative readings indicate bearish trends. Visual zones (Early, Confirmed, Strong) are clearly marked with color-coded horizontal lines to help you interpret the strength of the signal at a glance.
- Adaptive Smoothing :
For those who prefer quicker, more responsive signals (ideal for scalping), an adaptive smoothing option is available. When enabled, it applies a shorter smoothing period to the oscillator; otherwise, a more conservative base period is used.
- Reversal Alerts :
Yellow dots are plotted on the chart to highlight potential reversal points. These alerts are triggered when the oscillator crosses specific thresholds, coupled with volume and ATR conditions, signaling that a top or bottom may be forming.
- Customizable Filters :
- ATR Filter :Ensures that the market's volatility is above a set threshold before signaling.
- ADX Filter :Confirms sufficient trend strength.
- Volume Filter : Requires that trading volume surges above a multiple of its simple moving average, filtering out low-volume noise.
- Clear Signal Messaging :
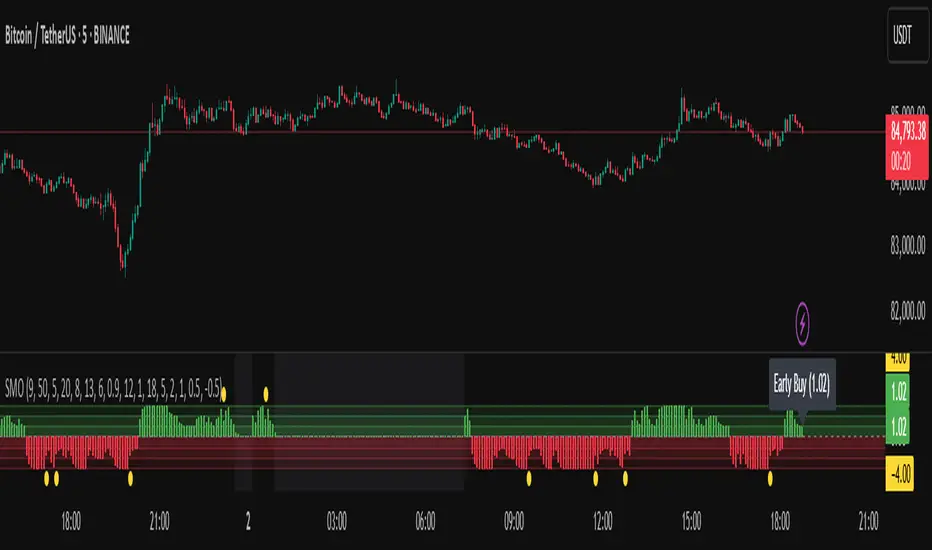
Based on the combined signals from various indicators, the script categorizes market sentiment into actionable messages such as "Early Buy", "Confirmed Buy", "Strong Buy", "Early Sell", "Confirmed Sell", and "Strong Sell". A "Grey Zone" label is used when the oscillator is near neutral, indicating that no clear trend is present.
How to Use :
1. Entry and Exit Decisions : Use the different signal stages (Early, Confirmed, Strong) as guides for your entries and exits.
2. Trend Confirmation : Rely on the multi-indicator setup for added confirmation of prevailing market conditions before executing trades.
3. Reversal Cues : Pay attention to the reversal dots for potential turning points in the market, which can be used to adjust positions or initiate trades.
Disclaimer:
This indicator is intended for educational and informational purposes only. It should not be taken as financial advice. Always use appropriate risk management and combine it with your analysis before making any trading decisions. Past performance is not indicative of future results.
By adhering to TradingView's publishing guidelines, the BullByte Sentiment Master is designed to provide transparency, simplicity, and robust analysis tools to enhance your trading strategy. Enjoy a clearer view of market sentiment and make more informed trading decisions!
Aggregated Spot vs Perp Volume (% Change)Aggregated Spot vs Perp Volume (% Change)
Description
The "Aggregated Spot vs Perp Volume (% Change)" indicator helps crypto traders compare the momentum of spot and perpetual futures (perp) trading volumes across 12 major exchanges. It calculates the percentage change in volume from one bar to the next, highlighting divergences and showing which market—spot or perp—is leading a move. By focusing on relative changes, it eliminates the issue of absolute volume differences, making trends clear.
The indicator aggregates data from Binance, Bybit, OKX, Coinbase, Bitget, MEXC, Phemex, BingX, WhiteBIT, BitMEX, Kraken, and HTX. Users can toggle exchanges and choose to measure volume in coin units (e.g., BTC) or USD.
How It Works
Volume Aggregation:
Fetches spot and perp volume data for the selected crypto (e.g., BTC) from up to 12 exchanges.
Spot volume is included only if perp volume is available for the same pair, ensuring consistency.
Volume can be measured in coin units or USD (volume × spot price).
Percentage Change:
Calculates the percentage change in spot and perp volumes from the previous bar:
Percentage Change = ((Current Volume − Previous Volume) / Previous Volume) ×100
This focuses on relative momentum, making spot and perp volumes directly comparable.
Visualization:
Spot volume % change is plotted as a blue line, and perp volume % change as a red line, both with a linewidth of 1.
Who Should Use It
Crypto Traders: To understand spot vs. perp market dynamics across exchanges.
Momentum Traders: To spot which market is driving price moves via volume divergences.
Scalpers/Day Traders: For identifying short-term shifts in market activity.
Analysts: To study liquidity and sentiment in crypto markets.
How to Use It
Blue line: Spot volume % change.
Red line: Perp volume % change.
Look for divergences (e.g., a sharp rise in the red line but not the blue line suggests perp markets are leading).
Combine with Price:
Use alongside price charts to confirm trends or spot potential reversals.
Context
Spot markets reflect actual asset trading, while perp markets, with leverage, attract speculative activity and often show higher volumes. This indicator uses percentage change to compare their momentum, helping traders identify market leadership and divergences. For example, a 50% increase in both spot and perp volumes plots at the same level, making it easy to see relative shifts across exchanges.

TSI Long/Short for BTC 2HThe TSI Long/Short for BTC 2H strategy is an advanced trend-following system designed specifically for trading Bitcoin (BTC) on a 2-hour timeframe. It leverages the True Strength Index (TSI) to identify momentum shifts and executes both long and short trades in response to dynamic market conditions.
Unlike traditional moving average-based strategies, this script uses a double-smoothed momentum calculation, enhancing signal accuracy and reducing noise. It incorporates automated position sizing, customizable leverage, and real-time performance tracking, ensuring a structured and adaptable trading approach.
🔹 What Makes This Strategy Unique?
Unlike simple crossover strategies or generic trend-following approaches, this system utilizes a customized True Strength Index (TSI) methodology that dynamically adjusts to market conditions.
🔸 True Strength Index (TSI) Filtering – The script refines the TSI by applying double exponential smoothing, filtering out weak signals and capturing high-confidence momentum shifts.
🔸 Adaptive Entry & Exit Logic – Instead of fixed thresholds, it compares the TSI value against a dynamically determined high/low range from the past 100 bars to confirm trade signals.
🔸 Leverage & Risk Optimization – Position sizing is dynamically adjusted based on account equity and leverage settings, ensuring controlled risk exposure.
🔸 Performance Monitoring System – A built-in performance tracking table allows traders to evaluate monthly and yearly results directly on the chart.
📊 Core Strategy Components
1️⃣ Momentum-Based Trade Execution
The strategy generates long and short trade signals based on the following conditions:
✅ Long Entry Condition – A buy signal is triggered when the TSI crosses above its 100-bar highest value (previously set), confirming bullish momentum.
✅ Short Entry Condition – A sell signal is generated when the TSI crosses below its 100-bar lowest value (previously set), indicating bearish pressure.
Each trade execution is fully automated, reducing emotional decision-making and improving trading discipline.
2️⃣ Position Sizing & Leverage Control
Risk management is a key focus of this strategy:
🔹 Dynamic Position Sizing – The script calculates position size based on:
Account Equity – Ensuring trade sizes adjust dynamically with capital fluctuations.
Leverage Multiplier – Allows traders to customize risk exposure via an adjustable leverage setting.
🔹 No Fixed Stop-Loss – The strategy relies on reversals to exit trades, meaning each position is closed when the opposite signal appears.
This design ensures maximum capital efficiency while adapting to market conditions in real time.
3️⃣ Performance Visualization & Tracking
Understanding historical performance is crucial for refining strategies. The script includes:
📌 Real-Time Trade Markers – Buy and sell signals are visually displayed on the chart for easy reference.
📌 Performance Metrics Table – Tracks monthly and yearly returns in percentage form, helping traders assess profitability over time.
📌 Trade History Visualization – Completed trades are displayed with color-coded boxes (green for long trades, red for short trades), visually representing profit/loss dynamics.
📢 Why Use This Strategy?
✔ Advanced Momentum Detection – Uses a double-smoothed TSI for more accurate trend signals.
✔ Fully Automated Trading – Removes emotional bias and enforces discipline.
✔ Customizable Risk Management – Adjust leverage and position sizing to suit your risk profile.
✔ Comprehensive Performance Tracking – Integrated reporting system provides clear insights into past trades.
This strategy is ideal for Bitcoin traders looking for a structured, high-probability system that adapts to both bullish and bearish trends on the 2-hour timeframe.
📌 How to Use: Simply add the script to your 2H BTC chart, configure your leverage settings, and let the system handle trade execution and tracking! 🚀

OBV TSI IndicatorThe OBV TSI Indicator combines two powerful technical analysis tools: the On-Balance Volume (OBV) and the True Strength Index (TSI). This hybrid approach provides insights into both volume dynamics and momentum, helping traders identify potential trend reversals, breakouts, or continuations with greater accuracy.
The OBV TSI Indicator tracks cumulative volume shifts via OBV and integrates the TSI for momentum analysis. It offers customizable moving average options for further smoothing. Visual trendlines, pivot points, and signal markers enhance clarity.
The OBV tracks volume flow by summing volumes based on price changes. Positive volume is added when prices rise, and negative volume is subtracted when prices fall. The result is smoothed to detect meaningful trends in volume. A volume spread is derived from the difference between the smoothed OBV and cumulative volume. This is then adjusted by the price deviation to generate the shadow spread, which highlights critical volume-driven price levels.
The shadow spread is added to either the high or low price, depending on its sign, producing a refined OBV output. This serves as the main source for the subsequent TSI calculation. The TSI is a momentum oscillator calculated using double-smoothed price changes. It provides an accurate measure of trend strength and direction.
Various moving average options, such as EMA, DEMA, or TEMA, are applied to the smoothed OBV for additional trend filtering. Users can select their preferred type and length to suit their trading strategy. Trendlines are plotted to visualize the overall direction. When a significant change in trend is detected, up or down arrows indicate potential buy or sell signals. The script identifies key pivot points based on the highest and lowest levels within a defined period. These pivots help pinpoint reversal zones.
The indicator offers customization options, allowing users to adjust the OBV length for smoothing, choose from various moving average types, and fine-tune the short, long, and signal periods for TSI. Additionally, users can toggle visibility for trendlines, signals, and pivots to suit their preferences.
This indicator is ideal for practical use cases such as spotting potential trend reversals by observing TSI crossovers and pivot levels, anticipating breakouts from key price levels using the shadow spread, and validating trends by aligning TSI signals with OBV and moving averages.
The OBV TSI Indicator is a versatile tool designed to enhance decision-making in trading by combining volume and momentum analysis. Its flexibility and visual aids make it suitable for traders of all experience levels. By leveraging its insights, you can confidently navigate market trends and improve your trading outcomes.

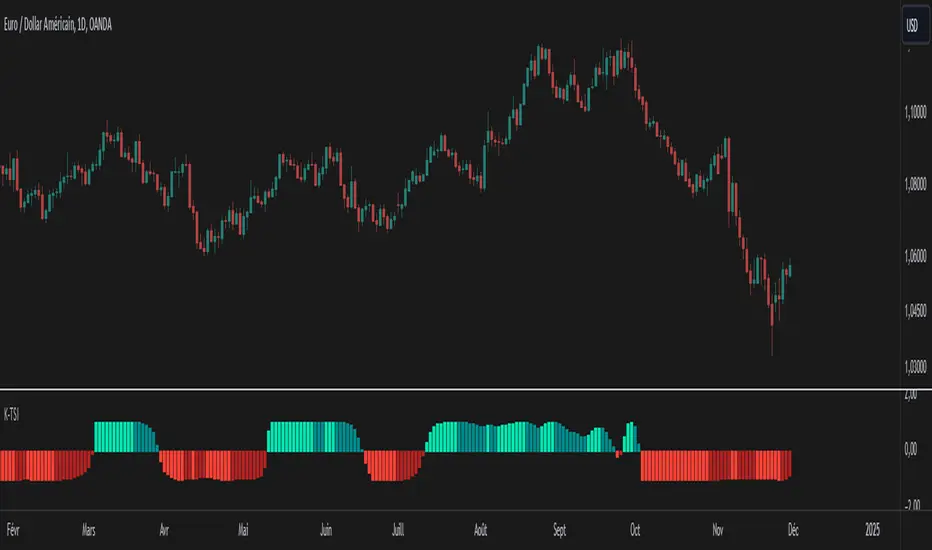
Kalman Trend Strength Index (K-TSI)The Kalman Trend Strength Index (K-TSI) is an innovative technical indicator that combines the Kalman filter with correlation analysis to measure trend strength in financial markets. This sophisticated tool aims to provide traders with a more refined method for trend analysis and market dynamics interpretation.
The use of the Kalman filter is a key feature of the K-TSI. This advanced algorithm is renowned for its ability to extract meaningful signals from noisy data. In financial markets, this translates to smoothing out price action while maintaining responsiveness to genuine market movements. By applying the Kalman filter to price data before performing correlation analysis, the K-TSI potentially offers more stable and reliable trend signals.
The synergy between the Kalman-filtered price data and correlation analysis creates an oscillator that attempts to capture market dynamics more effectively. The correlation component contributes by measuring the strength and consistency of price movements relative to time, while the Kalman filter adds robustness by reducing the impact of market noise. Basing these calculations on Kalman-filtered data may help reduce false signals and provide a clearer picture of underlying market trends.
A notable aspect of the K-TSI is its normalization process. This approach adjusts the indicator's values to a standardized range (-1 to 1), allowing for consistent interpretation across different market conditions and timeframes. This flexibility, combined with the noise-reduction properties of the Kalman filter, positions the K-TSI as a potentially useful tool for various market environments.
In practice, traders might find that the K-TSI offers several potential benefits:
Smoother trend identification, which could aid in detecting the start and end of trends more accurately.
Possibly reduced false signals, particularly in choppy or volatile markets.
Potential for improved trend strength assessment, which might lead to more confident trading decisions.
Consistent performance across different timeframes, due to the adaptive nature of the Kalman filter and the normalization process.
The K-TSI's visual representation as a color-coded histogram further enhances its utility. The changing colors and intensities provide an intuitive way to gauge both the direction and strength of trends, making it easier for traders to quickly assess market conditions.
While the K-TSI builds upon existing concepts in technical analysis, its integration of the Kalman filter with correlation analysis offers traders an interesting tool for market analysis. It represents an attempt to address common challenges in technical analysis, such as noise reduction and trend strength quantification.
As with any technical indicator, the K-TSI should be used as part of a broader trading strategy rather than in isolation. Its effectiveness will depend on how well it aligns with a trader's individual approach and market conditions. For traders looking to explore a more refined trend strength oscillator, the Kalman Trend Strength Index could be a worthwhile addition to their analytical toolkit.
Xtrender and TSI FusionXtrender and TSI Fusion Indicator
I created this indicator for myself. I was inspired by the indicators created by Bjorgum, Duyck and QuantTherapy and decided to create multiple indicators that either work well combined with their indicators or something new that applies some of their indicator concepts. I decided to share all of the indicator I have created because I believe in learning and earing together as a community. If you guys have any questions or suggestions write them.
Overview: The Xtrender and TSI Fusion Indicator is a powerful tool designed to help traders analyze market momentum, trends, and potential reversals. By combining Xtrender with the True Strength Index (TSI), this indicator provides a comprehensive view of market dynamics, making it easier to identify trading opportunities.
Image: Timeframe is set to daily
Features:
1.Xtrender Analysis:
Short-Term Xtrender: Visualizes short-term momentum using RSI-based calculations on EMA differences. This helps in identifying immediate market trends and pullbacks.
Image above: showcases Short-Term Xtrender
Xtrender T3: A smoothed version of the Xtrender that reduces noise and highlights significant trend changes.
Image above: showcases Xtrender T3 with Xtrender T3 color
2.TSI (True Strength Index):
TSI Value: Measures momentum by comparing price changes over two time periods, offering a clear view of trend strength.
TSI Signal Line: A smoothed version of the TSI value, used to generate buy and sell signals when crossed by the TSI.
Image: showcases TSI Value with TSI Signal Line
TSI Histogram: Shows the difference between the TSI and its signal line, highlighting potential reversals and trend continuations.
Image: showcases TSI Histogram
3.Color Coding and Visual Cues:
Trend Colors: The indicator uses dynamic colors to represent bullish or bearish conditions, making it easy to interpret market sentiment.
Background Color : The background changes color based on TSI signals, further aiding in visual trend analysis.
Image: showcases Background color and Zero line
How to Use
1.Xtrender Analysis:
Short-Term Xtrender: The short-term Xtrender is plotted as columns, changing color based on its direction and value. Green or lime indicates positive momentum, while red or maroon indicates negative momentum.
Xtrender T3: The Xtrender T3 line (black) represents a smoothed version of the short-term Xtrender, providing a clearer picture of the overall trend. The color of this line changes based on the Xtrender's value, helping you spot potential trend changes.
2.TSI (True Strength Index):
TSI Value and Signal Line: The TSI value is plotted as a line, with its color changing based on its relationship to the signal line. A crossover of the TSI above the signal line suggests a potential bullish move, while a crossover below indicates a bearish trend.
TSI Histogram: The histogram represents the difference between the TSI and its signal line. Positive values indicate bullish momentum, while negative values suggest bearish momentum.
3.Background Color:
The background color changes based on the TSI signal, with a greenish hue indicating bullish conditions and a reddish hue indicating bearish conditions. This provides a quick visual reference for market sentiment.
4.Zero Line:
A horizontal gray dotted line at the zero level helps you easily identify when the Xtrender or TSI crosses into positive or negative territory, signaling potential trend shifts.
Image above: Timeframe on daily with the individual elements combined
Example of Use:
•Trend Confirmation: Use the Xtrender and Xtrender T3 to confirm the direction of the trend. If both are aligned with the same color and direction, it increases the probability of a strong trend.
•Momentum Reversals: Watch for TSI crosses and histogram shifts to identify potential reversals. For example, a TSI crossover above its signal line with a corresponding change in the histogram from negative to positive could signal a buying opportunity.
•Pullbacks: Identify pullbacks within a trend by observing temporary shifts in the short-term Xtrender or TSI histogram. Use these signals to enter trades in the direction of the overall trend.
Image above: Showcases, Trend confirmation, reversal and pullbacks on daily timeframe.
Customization:
•TSI Speed: Choose between "Fast" and "Slow" TSI settings based on your trading style. Fast settings are more responsive to price changes, while slow settings offer smoother signals.
•Color Settings: Customize the colors for bullish, bearish, and neutral TSI conditions to match your personal preferences or chart theme.
This indicator is versatile and can be used for various trading strategies, from trend following to momentum trading, making it a valuable tool in any trader's arsenal.
My Scripts/Indicators/Ideas /Systems that I share are only for educational purposes

TSI w SuperTrend decision - Strategy [presentTrading]This strategy aims to improve upon the performance of Traidngview's newly published "Trend Strength Index" indicator by incorporating the SuperTrend for better trade execution and risk management. Enjoy :)
█ Introduction and How it is Different
The "TSI with SuperTrend Decision - Strategy" combines the Trend Strength Index (TSI) with SuperTrend indicators to determine entry and exit points. Unlike traditional strategies that rely solely on one indicator, this method leverages the strengths of both TSI and SuperTrend to provide a more nuanced and adaptive trading strategy.
This dual approach allows for capturing trends more effectively, especially in volatile markets.
BTCUSD 8h LS Performance
█ Strategy, How it Works: Detailed Explanation
🔶 Trend Strength Index (TSI)
The TSI is a momentum oscillator that shows both the direction and strength of a trend. It is calculated by comparing the price movement with the bar index over a specified period. The formula for TSI is as follows:
```
TSI = (PC / |PC|)
where:
PC = Change in price over the period
```
In this strategy, TSI is calculated using the closing prices and a default period of 64 bars. The TSI values help identify overbought and oversold conditions, providing signals for potential market reversals.
🔶 SuperTrend Indicator
The SuperTrend is a trend-following indicator based on the average true range (ATR). It helps in identifying the direction of the market trend. The SuperTrend calculation involves:
```
SuperTrend = HLC3 ± (Factor * ATR)
where:
HLC3 = (High + Low + Close) / 3
Factor = User-defined multiplier
ATR = Average True Range over a period
```
The SuperTrend settings in this strategy include a length of 10 bars and a factor of 3.0.
Last Bull Cycle of BTC
🔶 Entry and Exit Conditions
The strategy uses the TSI and SuperTrend together to determine entry and exit points:
- Long Entry: When the SuperTrend indicates a downward trend (st.d < 0) and the TSI is above the oversold level (-0.241).
- Long Exit: When the SuperTrend indicates an upward trend (st.d > 0) and the TSI is below the overbought level (0.241).
- Short Entry: When the SuperTrend indicates an upward trend (st.d > 0) and the TSI is below the overbought level (0.241).
- Short Exit: When the SuperTrend indicates a downward trend (st.d < 0) and the TSI is above the oversold level (-0.241).
█ Trade Direction
The strategy allows users to select the trade direction through the `tradeDirection` input. The options are:
- Both: Enables both long and short trades.
- Long: Enables only long trades.
- Short: Enables only short trades.
█ Default Settings
- TSI Length: 64
- SuperTrend Length: 10
- SuperTrend Factor: 3.0
- Trade Direction: Both
- Take Profit (%): 30.0
- Stop Loss (%): 20.0
Impact of Default Settings
- TSI Length: A longer TSI period smooths out noise but may lag in identifying trends. A shorter period is more responsive but can generate false signals.
- SuperTrend Length: A shorter length provides quicker signals but can be prone to whipsaws. A longer length is more reliable but may delay entries and exits.
- SuperTrend Factor: A higher factor increases the distance of the SuperTrend from the price, reducing sensitivity to minor price fluctuations.
- Trade Direction: Allows flexibility in trading strategies by enabling both long and short trades based on market conditions.
- Take Profit and Stop Loss: These settings manage risk by automatically closing trades at predefined profit or loss levels. Higher percentages provide larger potential gains but also higher risk.

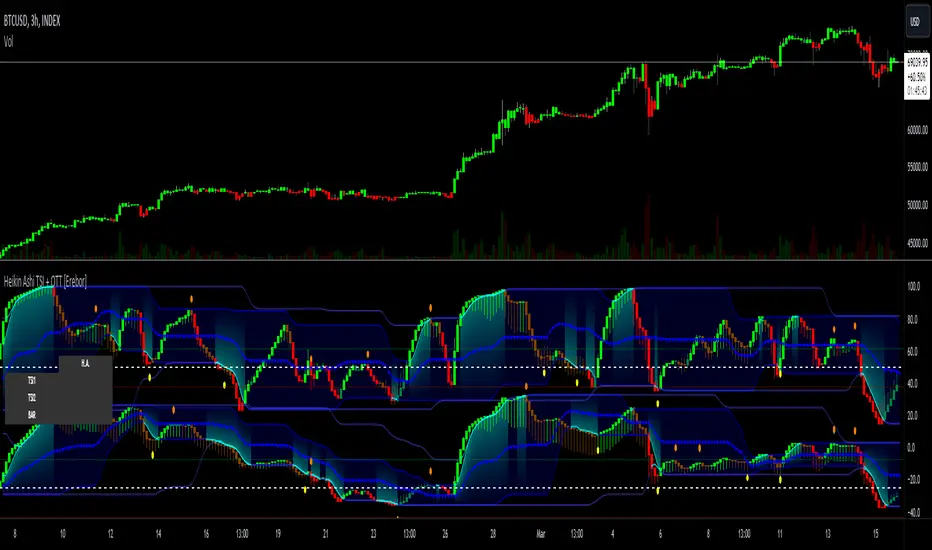
Heikin Ashi TSI and OTT [Erebor]TSI (True Strength Index)
The TSI (True Strength Index) is a momentum-based trading indicator used to identify trend direction, overbought/oversold conditions, and potential trend reversals in financial markets. It was developed by William Blau and first introduced in 1991.
Here's how the TSI indicator is calculated:
• Double Smoothed Momentum (DM): This is calculated by applying double smoothing to the price momentum. First, the single smoothed momentum is calculated by subtracting the smoothed closing price from the current closing price. Then, this single smoothed momentum is smoothed again using an additional smoothing period.
• Absolute Smoothed Momentum (ASM): This is calculated by applying smoothing to the absolute value of the price momentum. Similar to DM, ASM applies a smoothing period to the absolute value of the difference between the current closing price and the smoothed closing price.
• TSI Calculation: The TSI is calculated as the ratio of DM to ASM, multiplied by 100 to express it as a percentage. Mathematically, TSI = (DM / ASM) * 100.
The TSI indicator oscillates around a centerline (typically at zero), with positive values indicating bullish momentum and negative values indicating bearish momentum. Traders often look for crossovers of the TSI above or below the centerline to identify shifts in momentum and potential trend reversals. Additionally, divergences between price and the TSI can signal weakening trends and potential reversal points.
Pros of the TSI indicator:
• Smoothed Momentum: The TSI uses double smoothing techniques, which helps to reduce noise and generate smoother signals compared to other momentum indicators.
• Versatility: The TSI can be applied to various financial instruments and timeframes, making it suitable for both short-term and long-term trading strategies.
• Trend Identification: The TSI is effective in identifying the direction and strength of market trends, helping traders to align their positions with the prevailing market sentiment.
Cons of the TSI indicator:
• Lagging Indicator: Like many momentum indicators, the TSI is a lagging indicator, meaning it may not provide timely signals for entering or exiting trades during rapidly changing market conditions.
• False Signals: Despite its smoothing techniques, the TSI can still produce false signals, especially during periods of low volatility or ranging markets.
• Subjectivity: Interpretation of the TSI signals may vary among traders, leading to subjective analysis and potential inconsistencies in trading decisions.
Overall, the TSI indicator can be a valuable tool for traders when used in conjunction with other technical analysis tools and risk management strategies. It can help traders identify potential trading opportunities and confirm trends, but it's essential to consider its limitations and incorporate additional analysis for more robust trading decisions.
Heikin Ashi Candles
Let's consider a modification to the traditional “Heikin Ashi Candles” where we introduce a new parameter: the period of calculation. The traditional HA candles are derived from the open , high low , and close prices of the underlying asset.
Now, let's introduce a new parameter, period, which will determine how many periods are considered in the calculation of the HA candles. This period parameter will affect the smoothing and responsiveness of the resulting candles.
In this modification, instead of considering just the current period, we're averaging or aggregating the prices over a specified number of periods . This will result in candles that reflect a longer-term trend or sentiment, depending on the chosen period value.
For example, if period is set to 1, it would essentially be the same as traditional Heikin Ashi candles. However, if period is set to a higher value, say 5, each candle will represent the average price movement over the last 5 periods, providing a smoother representation of the trend but potentially with delayed signals compared to lower period values.
Traders can adjust the period parameter based on their trading style, the timeframe they're analyzing, and the level of smoothing or responsiveness they prefer in their candlestick patterns.
Optimized Trend Tracker
The "Optimized Trend Tracker" is a proprietary trading indicator developed by TradingView user ANIL ÖZEKŞİ. It is designed to identify and track trends in financial markets efficiently. The indicator attempts to smooth out price fluctuations and provide clear signals for trend direction.
The Optimized Trend Tracker uses a combination of moving averages and adaptive filters to detect trends. It aims to reduce lag and noise typically associated with traditional moving averages, thereby providing more timely and accurate signals.
Some of the key features and applications of the OTT include:
• Trend Identification: The indicator helps traders identify the direction of the prevailing trend in a market. It distinguishes between uptrends, downtrends, and sideways consolidations.
• Entry and Exit Signals: The OTT generates buy and sell signals based on crossovers and direction changes of the trend. Traders can use these signals to time their entries and exits in the market.
• Trend Strength: It also provides insights into the strength of the trend by analyzing the slope and momentum of price movements. This information can help traders assess the conviction behind the trend and adjust their trading strategies accordingly.
• Filter Noise: By employing adaptive filters, the indicator aims to filter out market noise and false signals, thereby enhancing the reliability of trend identification.
• Customization: Traders can customize the parameters of the OTT to suit their specific trading preferences and market conditions. This flexibility allows for adaptation to different timeframes and asset classes.
Overall, the OTT can be a valuable tool for traders seeking to capitalize on trending market conditions while minimizing false signals and noise. However, like any trading indicator, it is essential to combine its signals with other forms of analysis and risk management strategies for optimal results. Additionally, traders should thoroughly back-test the indicator and practice using it in a demo environment before applying it to live trading.
The following types of moving average have been included: "SMA", "EMA", "SMMA (RMA)", "WMA", "VWMA", "HMA", "KAMA", "LSMA", "TRAMA", "VAR", "DEMA", "ZLEMA", "TSF", "WWMA". Thanks to the authors.
Thank you for your indicator “Optimized Trend Tracker”. © kivancozbilgic
Thank you for your programming language, indicators and strategies. © TradingView
Kind regards.
© Erebor_GIT
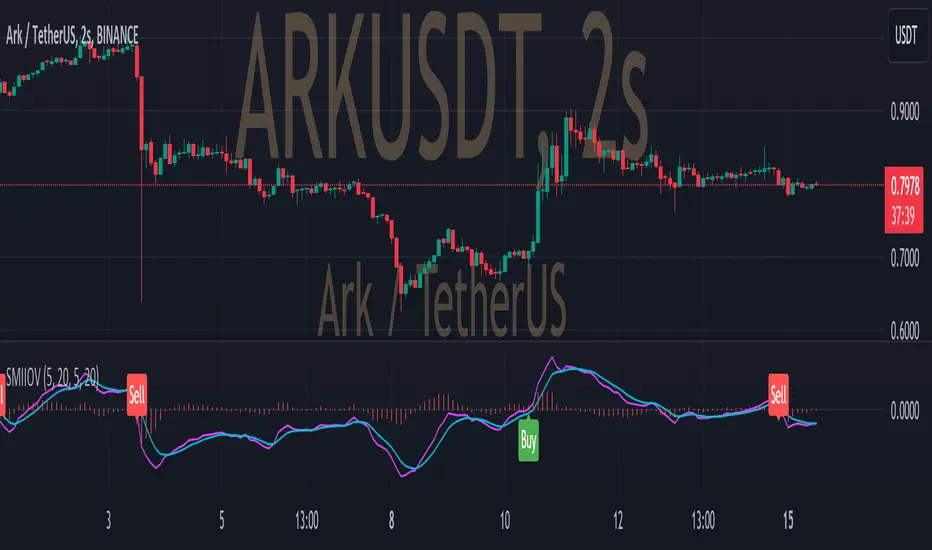
SMIIO + VolumeThis indicator generates long and short signals.
The operation of the indicator is as follows;
First, true strength index is calculated with closing prices. We call this the "ergodic" curve.
Then the average of the ergodic (ema) is calculated to obtain the "signal" curve.
To calculate the "oscillator", the signal is subtracted from ergodic (oscillator = ergodic - signal).
The last variable to be used in the calculation is the average volume, calculated with sma.
Calculation for long signal;
- If the ergodic curve cross up the zero line (ergodic > 0 AND ergodic < 0) and,
- If the current oscillator is greater than the previous oscillator (oscillator > oscillator ) and,
- If the current ergonic is greater than the previous signal (ergonic > signal) and,
- If the current volume is greater than the average volume (volume > averageVolume) and,
- If the current candle closing price is greater than the opening price (close > open)
If all the above conditions are fullfilled, the long input signal is issued with "Buy" label.
Calculation for short signal;
- If the ergodic curve cross down the zero line (ergodic < 0 AND ergodic > 0) and,
- If the current oscillator is smaller than the previous oscillator (oscillator < oscillator ) and,
- If the current ergonic is smaller than the previous signal (ergonic < signal) and,
- If the current volume is greater than the average volume (volume > averageVolume) and,
- If the current candle closing price is smaller than the opening price (close < open)
If all the above conditions are fullfilled, the short input signal is issued with "Sell" label.
TSI Market Timer + Volatility MeterThis is the TSI Market Timer. It is years in the making and it is comprised of four indicators in one. The stock (or source) is run through an indicator called the True Strength Indicator with settings(5,15) , then the TSI is run on both the Index(SPY) by default and what I call a Trigger line which is basically the TSI applied to the DXY (US Dollar Index).
Midline Volatility Indicator:
Lastly, we have a volatility indicator on the midline. The colors of the midline indicate levels of volatility. For the lowest volatility in the last 100 days, the dot turns dark blue. For the lowest volatility in 30 days, the dot turns aqua. For regular volatility, it remains orange. And last, for higher volatility of the last 100 days, it turns red. These are more or less arbitrary but they do come in handy.
Settings for Green/Red Shading:
Next on the indicator are the settings. You can toggle a color change between the stock/source and the index(spy). If the stock/source is greater than the index, it will color the area in between a green and if it is below the index, it will be red.
There is also a toggle for the stock/source and the trigger/DXY. This will also show green when the stock is above the trigger and red if it is below the trigger.
By turning on both of these, you get light green and dark green areas as well as red and darker red areas. The lighter green represent when the stock is above both the index and the trigger and conversely for the red areas.
Settings for vertical line crossings:
When the stock crosses the trigger/dxy line, it shows a green vertical line signal. When the stock crosses below the trigger/dxy, a red vertical line is shown.
You can turn these off by toggling them in the settings.
Stacked Condition:
Lastly, we have a "stacked condition" which shows up as a white triangle at the bottom when the condition of the stock being above the index and the trigger below the zero line.
New Highs:
If you see the stock line turn lime green, this indicates a new high was reached for the last 255 days/periods. This is like a new 52 week high signal.
Note:
This indicator is made mostly for the stock market. It may work ok during the week for crypto but using the trigger/dxy and index lines on the weekends doesn't work too well as they will be flat.
Also note that this indicator is not a recommendation to buy or sell any stock/instrument. It is only a study of market conditions. Any analysis should be followed up with volume analysis or other confirming indicators.
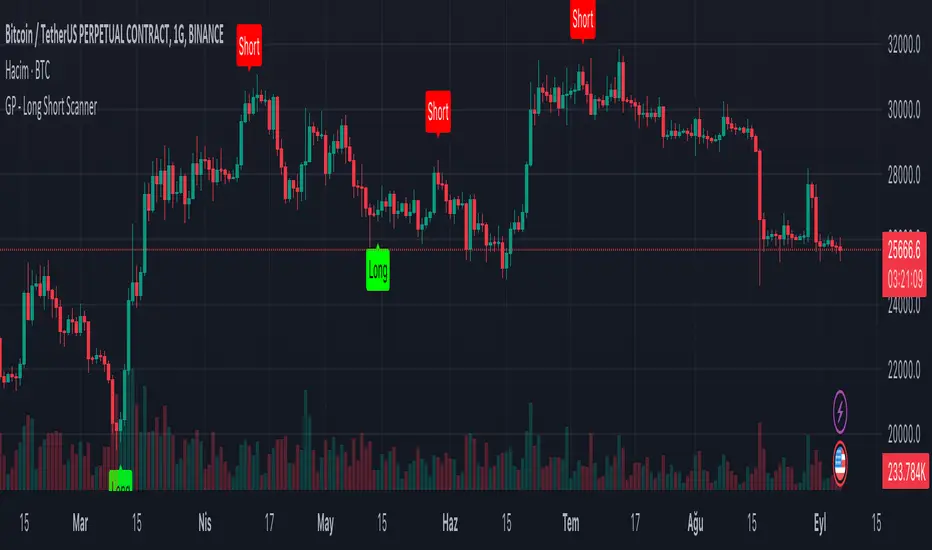
GP - Long Short ScannerThis script is made to predict the point at which price-time charts will rise or fall. The script was inspired by the RSI and TSI formulas. The formula is simply; Calculates the RSI and TSI values of open, high, low and close. Calculated values are converted to an array. The maximum and minimum values in the array are taken for the candles included in the calculation. These values calculate the time when the "Long" label will be seen on the chart of the candle that will increase the price. At the same time, it calculates the time when the "Short" label will appear on the chart of the candle that will decrease the price. Although these calculations are not precise; Seeing the “Long” label means that the price will rise at that candle, and seeing the “Short” label means that the price will decrease at that candle. The “Long”, “Short” tags from this script alone should not be used to determine the direction of the price. It can be used on all price-time charts.
Machine Learning Momentum Oscillator [ChartPrime]The Machine Learning Momentum Oscillator brings together the K-Nearest Neighbors (KNN) algorithm and the predictive strength of the Tactical Sector Indicator (TSI) Momentum. This unique oscillator not only uses the insights from TSI Momentum but also taps into the power of machine learning therefore being designed to give traders a more comprehensive view of market momentum.
At its core, the Machine Learning Momentum Oscillator blends TSI Momentum with the capabilities of the KNN algorithm. Introducing KNN logic allows for better handling of noise in the data set. The TSI Momentum is known for understanding how strong trends are and which direction they're headed, and now, with the added layer of machine learning, we're able to offer a deeper perspective on market trends. This is a fairly classical when it comes to visuals and trading.
Green bars show the trader when the asset is in an uptrend. On the flip side, red bars mean things are heading down, signaling a bearish movement driven by selling pressure. These color cues make it easier to catch the sentiment and direction of the market in a glance.
Yellow boxes are also displayed by the oscillator. These boxes highlight potential turning points or peaks. When the market comes close to these points, they can provide a heads-up about the possibility of changes in momentum or even a trend reversal, helping a trader make informed choices quickly. These can be looked at as possible reversal areas simply put.
Settings:
Users can adjust the number of neighbours in the KNN algorithm and choose the periods they prefer for analysis. This way, the tool becomes a part of a trader's strategy, adapting to different market conditions as they see fit. Users can also adjust the smoothing used by the oscillator via the smoothing input.

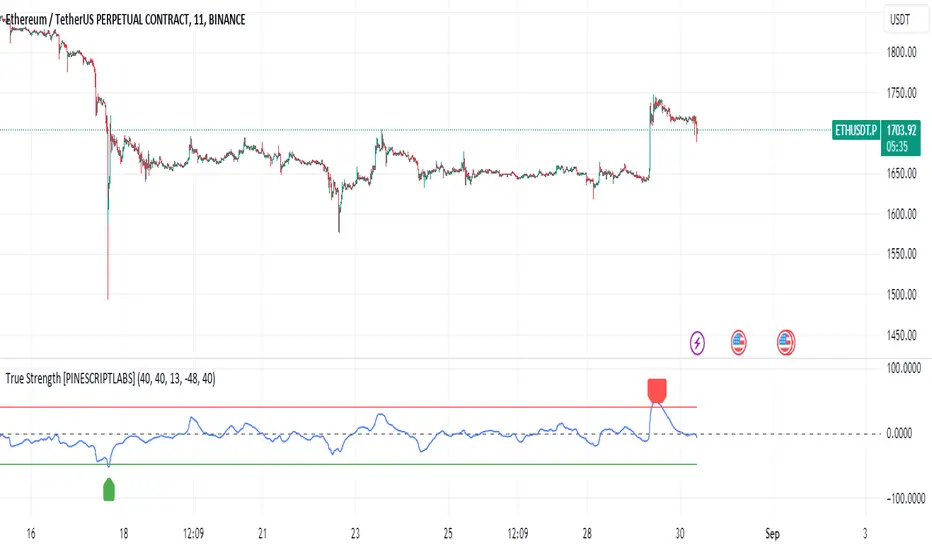
True Strength [PINESCRIPTLABS]This indicator is an implementation of the "True Strength Index" (TSI) developed by PINE_LABS for the Pine Script trading platform on TradingView. The True Strength Index is a technical indicator used to measure the strength and direction of a trend in a financial asset.
Here's an explanation of how this particular indicator works:
Buy Signal:
A buy signal is generated when the value of the True Strength Index (TSI) falls at or below the specified buy_tsi_value. This indicates a potential buying opportunity as the TSI suggests that the asset might be oversold or experiencing a potential reversal. When this condition is met, a green triangle shape is plotted below the corresponding price bar, indicating a potential buy signal.
Sell Signal:
Conversely, a sell signal is generated when the value of the TSI rises to or above the specified sell_tsi_value. This implies a potential selling opportunity as the TSI indicates that the asset might be overbought or facing a possible reversal. When this condition is met, a red triangle shape is plotted above the corresponding price bar, indicating a potential sell signal.
Note:
When we observe that the value of TSI (blue line) crosses above our parameter called TSI Sell (red Plot) it will open a sell operation, and on the contrary when our TSI (blue line) crosses below our TSI parameter ( Green Plot) will open a buy trade.
Este indicador es una implementación del "True Strength Index" (TSI) desarrollada por PINE_LABS para la plataforma de trading de Pine Script en TradingView. El True Strength Index es un indicador técnico que se utiliza para medir la fuerza y la dirección de una tendencia en un activo financiero.
Aquí hay una explicación de cómo funciona este indicador en particular:
Señal de Compra:
Una señal de compra se genera cuando el valor del Índice de Fuerza Verdadera (TSI) cae igual o por debajo del valor especificado en buy_tsi_value. Esto indica una posible oportunidad de compra, ya que el TSI sugiere que el activo podría estar sobrevendido o experimentando una reversión potencial. Cuando se cumple esta condición, se traza un triángulo verde debajo de la barra de precios correspondiente, indicando una posible señal de compra.
Señal de Venta:
Por otro lado, se genera una señal de venta cuando el valor del TSI sube igual o por encima del valor especificado en sell_tsi_value. Esto implica una posible oportunidad de venta, ya que el TSI indica que el activo podría estar sobrecomprado o enfrentando una posible reversión. Cuando se cumple esta condición, se traza un triángulo rojo encima de la barra de precios correspondiente, indicando una posible señal de venta.
Nota:
Cuando observamos que el valor de TSI ( linea azul) , cruza por arriba de nuestro parámetro llamado TSI Sell ( Plot rojo) abrirá una operacion de venta, y por el contrario cuando nuestro TSI ( linea azul) cruza por abajo de nuestro parámetro TSI ( Plot Verde) abrirá una operacion de compra.
Stochastic Momentum Index (SMI) of Money Flow Index (MFI)"He who does not know how to make predictions and makes light of his opponents, underestimating his ability, will certainly be defeated by them."
(Sun Tzu - The Art of War)
▮ Introduction
The Stochastic Momentum Index (SMI) is a technical analysis indicator that uses the difference between the current closing price and the high or low price over a specific time period to measure price momentum.
On the other hand, the Money Flow Index (MFI) is an indicator that uses volume and price to measure buying and selling pressure.
When these two indicators are combined, they can provide a more comprehensive view of price direction and market strength.
▮ Improvements
By combining SMI with MFI, we can gain even more insights into the market. One way to do this is to use the MFI as an input to the SMI, rather than just using price.
This means we are measuring momentum based on buying and selling pressure rather than just price.
Another way to improve this indicator is to adjust the periods to suit your specific trading needs.
▮ What to look
When using the SMI MFI indicator, there are a few things to look out for.
First, look at the SMI signal line.
When the line crosses above -40, it is considered a buy signal, while the crossing below +40 is considered a sell signal.
Also, pay attention to divergences between the SMI MFI and the price.
If price is rising but the SMI MFI is showing negative divergence, it could indicate that momentum is waning and a reversal could be in the offing.
Likewise, if price is falling but the SMI MFI is showing positive divergence, this could indicate that momentum is building and a reversal could also be in the offing.
In the examples below, I show the use in conjunction with the price SMI, in which the MFI SMI helps to anticipate divergences:
In summary, the SMI MFI is a useful indicator that can provide valuable insights into market direction and price strength.
By adjusting the timeframes and paying attention to divergences and signal line crossovers, traders can use it as part of a broader trading strategy.
However, remember that no indicator is a magic bullet and should always be used in conjunction with other analytics and indicators to make informed trading decisions.

Stochastic Momentum Index (SMI) Refurbished▮Introduction
Stochastic Momentum Index (SMI) Indicator is a technical indicator used in technical analysis of stocks and other financial instruments.
It was developed by William Blau in 1993 and is considered to be a momentum indicator that can help identify trend reversal points.
Basically, it's a combination of the True Strength Index with a signal line to help identify turning points in the market.
SMI uses the stochastic formula to compare the current closing price of an asset with the maximum and minimum price range over a specific period.
He then compares this ratio to a short-term moving average to create an indicator that oscillates between -100 and +100.
When the SMI is above 0, it is considered positive, indicating that the current price is above the short-term moving average.
When it is below 0, it is considered negative, indicating that the current price is below the short-term moving average.
Traders use the SMI to identify potential trend reversal points.
When the indicator reaches an extreme level above +40 or below -40, a trend reversal is possible.
Furthermore, traders also watch for divergences between the SMI and the asset price to identify potential trading opportunities.
It is important to remember that the SMI is a technical indicator and as such should be used in conjunction with other technical analysis tools to get a complete picture of the market situation.
▮ Improvements
The following features were added:
1. 7 color themes, for TSI, Signal and Histogram.
2. Possibility to customize moving average type for TSI/Signal.
3. Dynamic Zones.
4. Crossing Alerts.
5. Alert points on specific ranges.
5. Coloring of bars according to TSI/Signal/Histogram.
▮ Themes
Examples:
▮ About Dynamic Zones
'Most indicators use a fixed zone for buy and sell signals.
Here's a concept based on zones that are responsive to the past levels of the indicator.'
The concept of Dynamic Zones was described by Leo Zamansky ( Ph .D.) and David Stendahl, in the magazine of Stocks & Commodities V15:7 (306-310).
Basically, a statistical calculation is made to define the extreme levels, delimiting a possible overbought/oversold region.
Given user-defined probabilities, the percentile is calculated using the method of Nearest Rank.
It is calculated by taking the difference between the data point and the number of data points below it, then dividing by the total number of data points in the set.
The result is expressed as a percentage.
This provides a measure of how a particular value compares to other values in a data set, identifying outliers or values that are significantly higher or lower than the rest of the data.
▮ What to look for
1. Divergences/weakening of a trend/reversal:
2. Supports, resistances, pullbacks:
3. Overbought/Oversold Points:
▮ Thanks and Credits
- TradingView and PineCoders: for SMI and Moving Averages
- allanster: for Dynamic Zones

Athena Momentum Squeeze - Short, Lean, and Mean This is a very profitable strategy focusing on 15 minute intervals on the Micro Nasdaq Futures contracts. CME_MINI:MNQH2023
As this contract only keeps positions for on average about an hour risk is managed. At a profit factor of 3.382 with a max drawdown of $123 from January 1st to February 15. Looking back to Dec 2019 still maintains a profit factor of 1.3.
See backtesting: www.screencast.com
2019 backtesting: www.screencast.com
Based on the classic Lazy Bear Oscillator Squeeze with a number of modifications from ADX, MAs and adding fibonacci levels.
We like keeping strategies simple yet powerful, no completely where you can't understand your own trades.
Our team is always modifying and improving the strategy. Always open to collaborating on improving as there is no perfect strategy. www.screencast.com

Cheat Code's RedemptionWELCOME TO THE CHEAT CODE REDEMPTION PACK!!!!
I want to take a deep dive into what this indicator consists of and how you can use it to improve your trading strategy.
-What does the CCR consist of?
The Oscillator:
The oscillator is a combination of a true strength index sampled from on-balance volume and a regular RSI at default settings. The reason I added the on-balance volume is that it does not tend to remain at overbought or oversold conditions as traditional momentum oscillators do.
The Histogram:
The histogram is copied to a tee from the MACD histogram, the only difference here is that I extended the moving averages to depict a special pairing; the ema55 slow and ema21 fast. I then converted it into another true strength index, as the calculations fit all time frames.
The Divergences:
The divergences of an indicator can be extremely useful in catching scalp opportunities, a DARK RED/GREEN represents a REGULAR divergence, while a SALMON/LIGHT GREEN color represents a HIDDEN divergence.
The moving average:
The moving average built into this indicator is depicted as an aqua or yellow line, when the oscillator is moving in an uptrend, the moving average will appear aqua, when the oscillator is in a downtrend it will appear yellow. Use this as confirmation bias or as the third derivative of market position.
Oscillator Colors:
The Oscillator color is an important thesis of this indicator. When the line is green, it means the market is effectively in an uptrend, when it is red, it means the market is in a downtrend. Use this to prevent longing in a serious downtrend and vice versa.
If you have any questions regarding the indicator(s), feel free to reach out to me in the comments or through Direct Message!!!
Safe Trading, Don't get Rekt
- CheatCode1 <3

Divergence for Many Panel (D4MP+)Divergence for Many Panel (D4MP+)
This Divergence for Many Panel indicator is built upon the realtme divergence drawing code originally authored by LonesomeTheBlue, now in the form of a panel indicator.
The available oscillators, hand picked for their ability to identify high quality divergences currently include:
- Ultimate Oscillator (UO)
- True Strength Index (TSI)
- Money Flow Index (MFI)
- Relative Strength Index (RSI)
- Stochastic RSI
- Time Segmented Volume (TSV)
- Cumulative Delta Volume (CDV)
Note : this list of available oscillators may be added to or altered at a later date.
The indicator includes the following features:
- Ability to select any of the above oscillators
- Optional divergence lines drawn directly onto the oscillator in realtime .
- Configurable alerts to notify you when divergences occur.
- Configurable pivot lookback periods to fine tune the divergences drawn in order to suit different trading styles and timeframes, including the ability to enable automatic adjustment of pivot period per chart timeframe.
- Background colouring option to indicate when the selected oscillator has crossed above or below its centerline.
- Alternate timeframe feature allows you to configure the oscillator to use data from a different timeframe than the chart it is loaded on.
- Oscillator name label, so you can clearly see which oscillator is selected, in the case you have multiple loaded onto a chart.
- Optional adjustable range bands.
- Automatic adjustment of line colours, centerlines and range band levels on a per oscillator basis by default.
- Ability to customise the colours of each of the oscillators.
What is the Ultimate Oscillator ( UO )?
“The Ultimate Oscillator indicator (UO) indicator is a technical analysis tool used to measure momentum across three varying timeframes. The problem with many momentum oscillators is that after a rapid advance or decline in price, they can form false divergence trading signals. For example, after a rapid rise in price, a bearish divergence signal may present itself, however price continues to rise. The ultimate Oscillator attempts to correct this by using multiple timeframes in its calculation as opposed to just one timeframe which is what is used in most other momentum oscillators.”
What is the True Strength Index ( TSI )?
"The true strength index (TSI) is a technical momentum oscillator used to identify trends and reversals. The indicator may be useful for determining overbought and oversold conditions, indicating potential trend direction changes via centerline or signal line crossovers, and warning of trend weakness through divergence."
What is the Money Flow Index ( MFI )?
“The Money Flow Index ( MFI ) is a technical oscillator that uses price and volume data for identifying overbought or oversold signals in an asset. It can also be used to spot divergences which warn of a trend change in price. The oscillator moves between 0 and 100. Unlike conventional oscillators such as the Relative Strength Index ( RSI ), the Money Flow Index incorporates both price and volume data, as opposed to just price. For this reason, some analysts call MFI the volume-weighted RSI .”
What is the Relative Strength Index ( RSI )?
"The relative strength index (RSI) is a momentum indicator used in technical analysis. RSI measures the speed and magnitude of a security's recent price changes to evaluate overvalued or undervalued conditions in the price of that security. The RSI can do more than point to overbought and oversold securities. It can also indicate securities that may be primed for a trend reversal or corrective pullback in price. It can signal when to buy and sell. Traditionally, an RSI reading of 70 or above indicates an overbought situation. A reading of 30 or below indicates an oversold condition. It is also commonly used to identify divergences."
What is the Stochastic RSI (StochRSI)?
"The Stochastic RSI (StochRSI) is an indicator used in technical analysis that ranges between zero and one (or zero and 100 on some charting platforms) and is created by applying the Stochastic oscillator formula to a set of relative strength index (RSI) values rather than to standard price data. Using RSI values within the Stochastic formula gives traders an idea of whether the current RSI value is overbought or oversold. The StochRSI oscillator was developed to take advantage of both momentum indicators in order to create a more sensitive indicator that is attuned to a specific security's historical performance rather than a generalized analysis of price change."
What Is Time Segmented Volume?
"Time segmented volume (TSV) is a technical analysis indicator developed by Worden Brothers Inc. that segments a stock's price and volume according to specific time intervals. The price and volume data is then compared to uncover periods of accumulation (buying) and distribution (selling)."
What is Cumulative Volume Delta ( CDV )?
"The CDV analyses the net buying at market price and net selling at market price. This means, that volume delta is measuring whether it is the buyers or sellers that are more aggressive in taking the current market price. It measures the degree of intent by buyers and sellers, which can be used to indicate who is more dominant. The CDV can be used to help identify possible trends and also divergences"
What are divergences?
Divergence is when the price of an asset is moving in the opposite direction of a technical indicator, such as an oscillator, or is moving contrary to other data. Divergence warns that the current price trend may be weakening, and in some cases may lead to the price changing direction.
There are 4 main types of divergence, which are split into 2 categories;
regular divergences and hidden divergences. Regular divergences indicate possible trend reversals, and hidden divergences indicate possible trend continuation.
Regular bullish divergence: An indication of a potential trend reversal, from the current downtrend, to an uptrend.
Regular bearish divergence: An indication of a potential trend reversal, from the current uptrend, to a downtrend.
Hidden bullish divergence: An indication of a potential uptrend continuation.
Hidden bearish divergence: An indication of a potential downtrend continuation.
Setting alerts.
With this indicator you can set alerts to notify you when any/all of the above types of divergences occur, on any chart timeframe you choose.
Configurable pivot periods.
You can adjust the default pivot periods to suit your prefered trading style and timeframe. If you like to trade a shorter time frame, lowering the default lookback values will make the divergences drawn more sensitive to short term price action.
How do traders use divergences in their trading?
A divergence is considered a leading indicator in technical analysis , meaning it has the ability to indicate a potential price move in the short term future.
Hidden bullish and hidden bearish divergences, which indicate a potential continuation of the current trend are sometimes considered a good place for traders to begin, since trend continuation occurs more frequently than reversals, or trend changes.
When trading regular bullish divergences and regular bearish divergences, which are indications of a trend reversal, the probability of it doing so may increase when these occur at a strong support or resistance level . A common mistake new traders make is to get into a regular divergence trade too early, assuming it will immediately reverse, but these can continue to form for some time before the trend eventually changes, by using forms of support or resistance as an added confluence, such as when price reaches a moving average, the success rate when trading these patterns may increase.
Typically, traders will manually draw lines across the swing highs and swing lows of both the price chart and the oscillator to see whether they appear to present a divergence, this indicator will draw them for you, quickly and clearly, and can notify you when they occur.
Disclaimer : This script includes code from several stock indicators by Tradingview as well as the Divergence for Many Indicators v4 by LonesomeTheBlue. With special thanks.

True Strength IndexThe True Strength Index (TSI) is a technical momentum oscillator that can help identify trends and spot reversals. This indicator was developed with about an hour of research, based on the original True Strength Index formula by William Blau. The research material used to create this indicator can be found in the script (released publicly).
Author Notes:
- The zero line is included in this script, since it's a standard feature of the True Strength Index momentum oscillator.
- I did not include support and resistance levels, as I'm still researching the best way to incorporate this, rather than using a simple horizontal line for each.
- The original True Strength Index momentum oscillator utilizes the Exponential Moving Average, but with this release, you have the option to use the Hull Moving Average (as an alternative). Feel free to experiment and adjust the settings to whatever suits your trading style.
- I plan on improving/updating this indicator, but for now, releasing this early version.
* This is being provided as is and the information provided by this script is meant for informational/entertainment purposes only.

TSI + DivergencesTrue Strength Indicator (TSI) + Divergences + Alerts + Lookback periods.
This version of the True Strength Indicator adds the following 3 additional features to the stock TSI by Tradingview:
- Optional divergence lines drawn directly onto the oscillator.
- Configurable alerts to notify you when divergences occur.
- Configurable lookback periods to fine tune the divergences drawn in order to suit different trading styles and timeframes.
This indicator adds additional features onto the stock TSI by Tradingview, whose core calculations remain unchanged. Namely the configurable option to automatically, quickly and clearly draw divergence lines onto the oscillator for you as they occur, with minimal delay. It also has the addition of unique alerts, so you can be notified when divergences occur without spending all day watching the charts. Furthermore, this version of the TSI comes with configurable lookback periods, which can be configured in order to adjust the sensitivity of the divergences, in order to suit shorter or higher timeframe trading approaches.
The True Strength Indicator
Tradingview describes the True Strength Indicator as follows:
“The True Strength Index (TSI) is a momentum oscillator that ranges between limits of -100 and +100 and has a base value of 0. Momentum is positive when the oscillator is positive (pointing to a bullish market bias) and vice versa. It was developed by William Blau and consists of 2 lines: the index line and an exponential moving average of the TSI, called the signal line. Traders may look for any of the following 5 types of conditions: overbought, oversold, centerline crossover, divergence and signal line crossover. The indicator is often used in combination with other signals..”
What are divergences?
Divergence is when the price of an asset is moving in the opposite direction of a technical indicator, such as an oscillator, or is moving contrary to other data. Divergence warns that the current price trend may be weakening, and in some cases may lead to the price changing direction.
There are 4 main types of divergence, which are split into 2 categories;
regular divergences and hidden divergences. Regular divergences indicate possible trend reversals, and hidden divergences indicate possible trend continuation.
Regular bullish divergence: An indication of a potential trend reversal, from the current downtrend, to an uptrend.
Regular bearish divergence: An indication of a potential trend reversal, from the current uptrend, to a downtrend.
Hidden bullish divergence: An indication of a potential uptrend continuation.
Hidden bearish divergence: An indication of a potential downtrend continuation.
Setting alerts.
With this indicator you can set alerts to notify you when any/all of the above types of divergences occur, on any chart timeframe you choose.
Configurable lookback values.
You can adjust the default lookback values to suit your prefered trading style and timeframe. If you like to trade a shorter time frame, lowering the default lookback values will make the divergences drawn more sensitive to short term price action.
How do traders use divergences in their trading?
A divergence is considered a leading indicator in technical analysis, meaning it has the ability to indicate a potential price move in the short term future.
Hidden bullish and hidden bearish divergences, which indicate a potential continuation of the current trend are sometimes considered a good place for traders to begin, since trend continuation occurs more frequently than reversals, or trend changes.
When trading regular bullish divergences and regular bearish divergences, which are indications of a trend reversal, the probability of it doing so may increase when these occur at a strong support or resistance level. A common mistake new traders make is to get into a regular divergence trade too early, assuming it will immediately reverse, but these can continue to form for some time before the trend eventually changes, by using forms of support or resistance as an added confluence, such as when price reaches a moving average, the success rate when trading these patterns may increase.
Typically, traders will manually draw lines across the swing highs and swing lows of both the price chart and the oscillator to see whether they appear to present a divergence, this indicator will draw them for you, quickly and clearly, and can notify you when they occur.
Disclaimer : This script includes code from the stock TSI by Tradingview as well as the RSI divergence indicator.

Follow The Ranging Hull - studyFollow the Ranging hull - Study is a scalping indicator based off momentum and trend
It indicates the current momentum, and shows the momentum and true strength of a higher timeframe through a status window.
Credits:
Hull Suite by InSilico www.tradingview.com
Range Filter Buy and Sell 5 min www.tradingview.com
Follow Line Indicator by Dreadblitz www.tradingview.com
TSI by Everget www.tradingview.com
