OPEN-SOURCE SCRIPT
Distribution Histogram [SS]
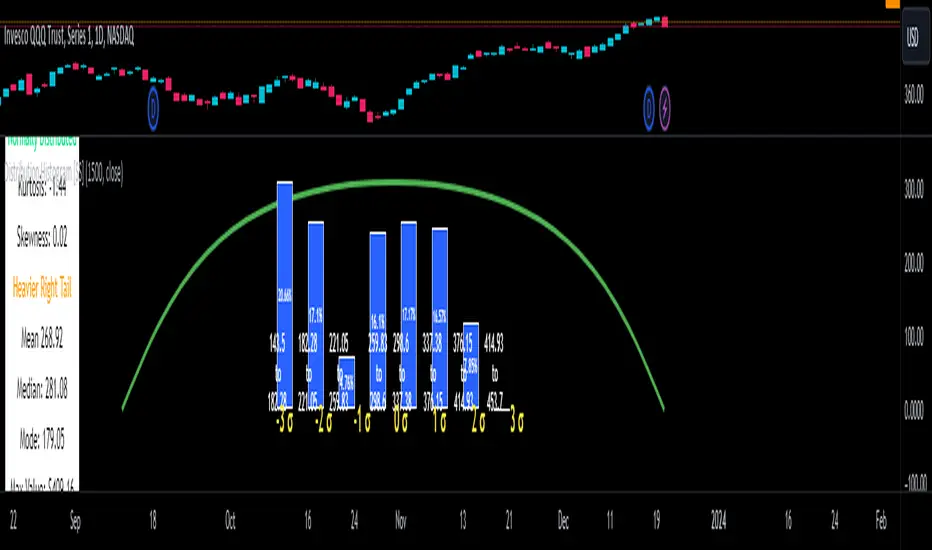
This is the frequency histogram indicator. It does just that—creates a frequency histogram distribution based on your desired lookback period. It then uses Pine's new Polyline function to plot a normal curve of the expected results for a normal distribution. This allows you to see quite a few things:
🎯 Firstly, it allows you to see where the accumulation rests in terms of a bell curve. The histogram represents a bell curve, and you can visually observe what the curve would look like.
🎯 Secondly, it will assess the normal distribution and the degree of skewness based on the curve itself. The indicator imports the SPTS statistics library to assess the distribution using Kurtosis and Skewness. However, it also adds functionality in this regard by making a qualitative assessment of the data. For example, if there are heavy left tails or heavier right tails present in the histogram, the indicator will alert you that a heavier left or right tail has been observed.
🎯 Thirdly, it provides you with the kurtosis and skewness of the dataset.
🎯 Fourthly, it provides the mean, median, and mode of the dataset, as well as the maximum and minimum values within the dataset.
🎯 Lastly, it provides you with the ability to toggle on tips/explanations of the curve itself. Simply toggle on "Show Distribution Explanation" in the settings menu:

How is the indicator helpful for trading?
If you are a mean reversion trader, this helps you identify the areas and price ranges of high and low accumulation. It also allows you to ascertain the probability by looking at the standard deviation of the bell curve. Remember, the majority of values should fall between -1 and 1 standard deviation of the mean (68%).
If it is revealed that the distribution has a heavier right or left tail, you will know that the stock is more likely to experience sudden drops and shifts in the curve in one direction or the other. Heavier left tails will tend to shift to the values on the far left, and vice versa for right tails.
Customization
You can turn off and on the following:
👉 The normal curve,
👉 The standard deviation levels, and
👉 The distribution explanations and tips.
Conclusion: And that is the indicator! Hope you enjoy it!
🎯 Firstly, it allows you to see where the accumulation rests in terms of a bell curve. The histogram represents a bell curve, and you can visually observe what the curve would look like.
🎯 Secondly, it will assess the normal distribution and the degree of skewness based on the curve itself. The indicator imports the SPTS statistics library to assess the distribution using Kurtosis and Skewness. However, it also adds functionality in this regard by making a qualitative assessment of the data. For example, if there are heavy left tails or heavier right tails present in the histogram, the indicator will alert you that a heavier left or right tail has been observed.
🎯 Thirdly, it provides you with the kurtosis and skewness of the dataset.
🎯 Fourthly, it provides the mean, median, and mode of the dataset, as well as the maximum and minimum values within the dataset.
🎯 Lastly, it provides you with the ability to toggle on tips/explanations of the curve itself. Simply toggle on "Show Distribution Explanation" in the settings menu:
How is the indicator helpful for trading?
If you are a mean reversion trader, this helps you identify the areas and price ranges of high and low accumulation. It also allows you to ascertain the probability by looking at the standard deviation of the bell curve. Remember, the majority of values should fall between -1 and 1 standard deviation of the mean (68%).
If it is revealed that the distribution has a heavier right or left tail, you will know that the stock is more likely to experience sudden drops and shifts in the curve in one direction or the other. Heavier left tails will tend to shift to the values on the far left, and vice versa for right tails.
Customization
You can turn off and on the following:
👉 The normal curve,
👉 The standard deviation levels, and
👉 The distribution explanations and tips.
Conclusion: And that is the indicator! Hope you enjoy it!
Script open-source
Nello spirito di TradingView, l'autore di questo script lo ha reso open source, in modo che i trader possano esaminarne e verificarne la funzionalità. Complimenti all'autore! Sebbene sia possibile utilizzarlo gratuitamente, ricordiamo che la ripubblicazione del codice è soggetta al nostro Regolamento.
Get:
- Live Updates,
- Discord access,
- Access to my Proprietary Merlin Software,
- Access to premium indicators,
patreon.com/steversteves
Now on X!
- Live Updates,
- Discord access,
- Access to my Proprietary Merlin Software,
- Access to premium indicators,
patreon.com/steversteves
Now on X!
Declinazione di responsabilità
Le informazioni e le pubblicazioni non sono intese come, e non costituiscono, consulenza o raccomandazioni finanziarie, di investimento, di trading o di altro tipo fornite o approvate da TradingView. Per ulteriori informazioni, consultare i Termini di utilizzo.