OPEN-SOURCE SCRIPT
Aggiornato Oscillating Market Case Study
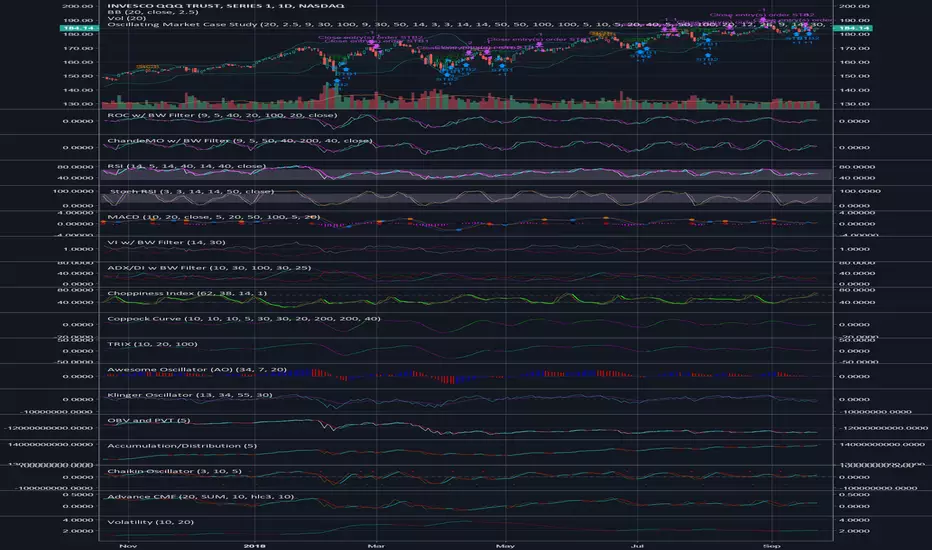
This is a little something I created to analyze the market. Ultimately, I wanted to create something that could encapsulate the entire market as best as possible. The idea was simple, use technical analysis to create cases that would indicate entry positions and exit positions for long positions initially. After completing that, I decided to add a few shorting cases.
A combination of 25-30 indicators were used to create this, and the indicators were modified with a filter to create a smoothed overlay.
So here's the breakdown:
- 10 total cases: 7 long, 3 short
- The 7 long cases are broken down into three categories; long term, medium term, short term
- Short Term: OC1, OC2, STB1, STB2
- Medium Term: STB1, STB2
- Long Term: LTB1
- Shorting Cases: SC1, SC2, SC3
- The cases are both plotted as text and entry orders; this can be toggled on and off through the format menu.
I suggest you use the format menu to get the most out of this script. The menu consists of toggles to turn of the plots and/or the entries. It's pretty self explanatory. Use it to keep the chart cleared and concise so you only visualise the cases that you need.
Personally, the cases that have worked the best for me are:
- Long Cases: OC1, OC2, STB2, LTB1
- Shorting Cases: SC2, SC3
I kept this description as short as possible, but please feel free to reach out if you have any questions.
Pretty much, use the cases and see if it works for you.
Note di rilascio
Wanted to post a clearer picture without all the indicators. Work with the toggles in the format menu, it will let you filter which cases you see and allow you to decide the best combinations. Wish I could post images with a tutorial. Let me know if you have any questions. This is a little something I created to analyze the market. Ultimately, I wanted to create something that could encapsulate the entire market as best as possible. The idea was simple, use technical analysis to create cases that would indicate entry positions and exit positions for long positions initially. After completing that, I decided to add a few shorting cases.
A combination of 25-30 indicators were used to create this, and the indicators were modified with a filter to create a smoothed overlay.
So here's the breakdown:
- 10 total cases: 7 long, 3 short
- The 7 long cases are broken down into three categories; long term, medium term, short term
- Short Term: OC1, OC2, STB1, STB2
- Medium Term: STB1, STB2
- Long Term: LTB1
- Shorting Cases: SC1, SC2, SC3
- The cases are both plotted as text and entry orders; this can be toggled on and off through the format menu.
I suggest you use the format menu to get the most out of this script. The menu consists of toggles to turn of the plots and/or the entries. It's pretty self explanatory. Use it to keep the chart cleared and concise so you only visualise the cases that you need.
Personally, the cases that have worked the best for me are:
- Long Cases: OC1, OC2, STB2, LTB1
- Shorting Cases: SC2, SC3
I kept this description as short as possible, but please feel free to reach out if you have any questions.
Pretty much, use the cases and see if it works for you.
Script open-source
Nello spirito di TradingView, l'autore di questo script lo ha reso open source, in modo che i trader possano esaminarne e verificarne la funzionalità. Complimenti all'autore! Sebbene sia possibile utilizzarlo gratuitamente, ricordiamo che la ripubblicazione del codice è soggetta al nostro Regolamento.
Declinazione di responsabilità
Le informazioni e le pubblicazioni non sono intese come, e non costituiscono, consulenza o raccomandazioni finanziarie, di investimento, di trading o di altro tipo fornite o approvate da TradingView. Per ulteriori informazioni, consultare i Termini di utilizzo.