OPEN-SOURCE SCRIPT
Custom Paul MACD-like

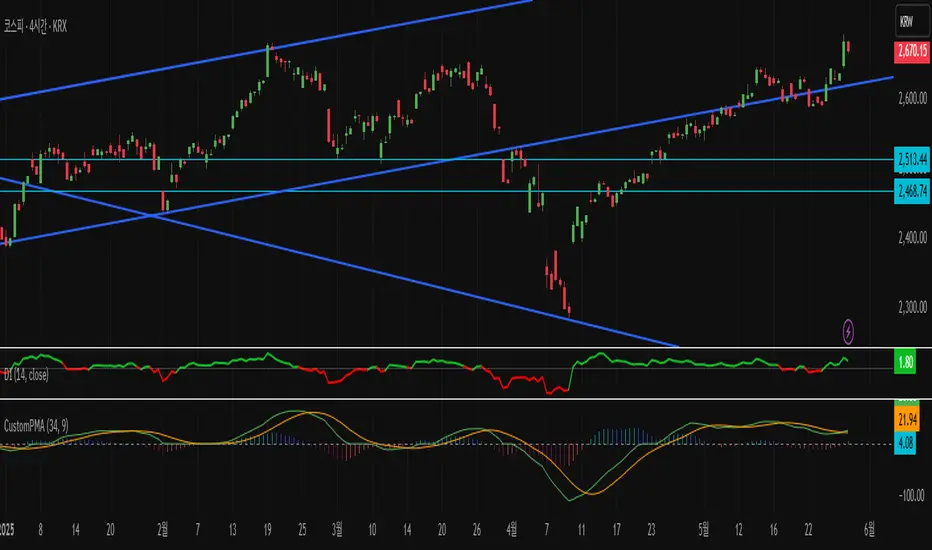
Paul MACD is an indicator created by David Paul. It is implemented to effectively represent trend periods and non-trend (sideways/consolidation) periods, and its calculation method is particularly designed to reduce whipsaw.
Unlike the existing MACD which uses the difference between short-term (12) and long-term (26) exponential moving averages (EMA), Paul MACD has a different calculation method. This indicator uses a "center value" or "intermediate value". Calculation occurs when this intermediate value is higher than the High value (specifically, the difference between the center and High is calculated) or lower than the Low value (specifically, the difference between the center and Low is calculated). Otherwise, the value becomes 0. Here, the High and Low values are intended to be smoothly reflected using Smoothed Moving Average (SMMA). The indicator's method itself (using SMMA and ZLMA) is aimed at diluting whipsaws.
Thanks to this calculation method, in sections where whipsaw occurs, meaning when the intermediate value is between High and Low, the indicator value is expressed as 0 and appears as a horizontal line (zero line). This serves to visually clearly show sideways/consolidation periods.
Script open-source
Nello spirito di TradingView, l'autore di questo script lo ha reso open source, in modo che i trader possano esaminarne e verificarne la funzionalità. Complimenti all'autore! Sebbene sia possibile utilizzarlo gratuitamente, ricordiamo che la ripubblicazione del codice è soggetta al nostro Regolamento.
Declinazione di responsabilità
Le informazioni e le pubblicazioni non sono intese come, e non costituiscono, consulenza o raccomandazioni finanziarie, di investimento, di trading o di altro tipo fornite o approvate da TradingView. Per ulteriori informazioni, consultare i Termini di utilizzo.