OPEN-SOURCE SCRIPT
Aggiornato MACD Dashboard
The MACD Dashboard is an addition to my collection of various dashboards that are designed to help traders make wiser decisions.
How to Use MACD Dashboard:
How to Use MACD Dashboard:
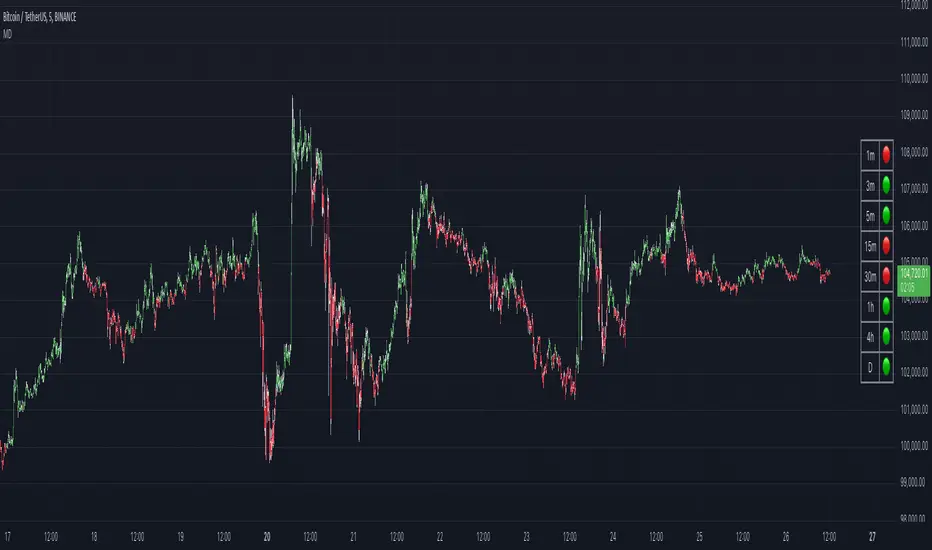
- Timeframe Selection: Based on your trading style and preferences, choose the relevant timeframes. In the settings, enable or disable timeframes to focus on the most relevant ones for your strategy.
- Dashboard Interpretation: The MACD Dashboard displays green (🟢) and red (🔴) symbols to indicate when the MACD is in green or in the red zone. You can also leverage the MACD values on the dashboard to better interpret sentiment and its changes.
- Confirmation and Strategy: Consider MACD Dashboard signals as confirmation for your trading strategy. For instance, in an uptrend, look for long opportunities when the dashboard displays consistent green symbols. Conversely, in a downtrend, focus on short opportunities when red symbols dominate.
- Risk Management: As with any indicator, use the MACD Dashboard in conjunction with proper risk management techniques. Avoid trading solely based on indicator signals; instead, integrate them into a comprehensive trading plan.
Note di rilascio
🏎️ Improved performance: Optimized the indicator’s calculations for faster loading and smoother experience.🐛 Bug fix: Resolved an issue where the indicator did not display on instruments that don’t support intraday timeframes.
Note di rilascio
🛠️ Revert the change related to intraday timeframes. Turned out it's a limitation of TradingView that cannot be bypassed, and my workaround broke the intraday on some other funds, such as leveraged assets.Script open-source
Nello spirito di TradingView, l'autore di questo script lo ha reso open source, in modo che i trader possano esaminarne e verificarne la funzionalità. Complimenti all'autore! Sebbene sia possibile utilizzarlo gratuitamente, ricordiamo che la ripubblicazione del codice è soggetta al nostro Regolamento.
Declinazione di responsabilità
Le informazioni e le pubblicazioni non sono intese come, e non costituiscono, consulenza o raccomandazioni finanziarie, di investimento, di trading o di altro tipo fornite o approvate da TradingView. Per ulteriori informazioni, consultare i Termini di utilizzo.
Script open-source
Nello spirito di TradingView, l'autore di questo script lo ha reso open source, in modo che i trader possano esaminarne e verificarne la funzionalità. Complimenti all'autore! Sebbene sia possibile utilizzarlo gratuitamente, ricordiamo che la ripubblicazione del codice è soggetta al nostro Regolamento.
Declinazione di responsabilità
Le informazioni e le pubblicazioni non sono intese come, e non costituiscono, consulenza o raccomandazioni finanziarie, di investimento, di trading o di altro tipo fornite o approvate da TradingView. Per ulteriori informazioni, consultare i Termini di utilizzo.