OPEN-SOURCE SCRIPT
Financial Astrology Ceres Declination
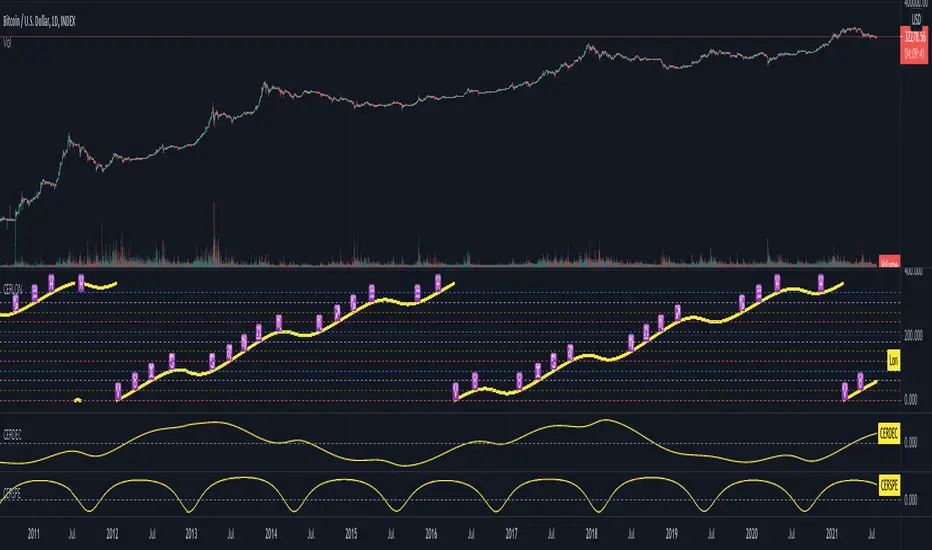
Ceres declination shows similar trend behaviour as we have seen with other planets, when moving from South to North the dominant BTCUSD trend is bullish, when moving from North to South the dominant trend is bearish. We observe that the periods of most intense corrections have occurred when Ceres was located in South declination.
Note: The Ceres declination indicator is based on an ephemeris array that covers years 2010 to 2030, prior or after this years the data is not available, this daily ephemeris are based on UTC time so in order to align properly with the price bars times you should set UTC as your chart timezone.
Note: The Ceres declination indicator is based on an ephemeris array that covers years 2010 to 2030, prior or after this years the data is not available, this daily ephemeris are based on UTC time so in order to align properly with the price bars times you should set UTC as your chart timezone.
Script open-source
Nello spirito di TradingView, l'autore di questo script lo ha reso open source, in modo che i trader possano esaminarne e verificarne la funzionalità. Complimenti all'autore! Sebbene sia possibile utilizzarlo gratuitamente, ricordiamo che la ripubblicazione del codice è soggetta al nostro Regolamento.
Declinazione di responsabilità
Le informazioni e le pubblicazioni non sono intese come, e non costituiscono, consulenza o raccomandazioni finanziarie, di investimento, di trading o di altro tipo fornite o approvate da TradingView. Per ulteriori informazioni, consultare i Termini di utilizzo.