OPEN-SOURCE SCRIPT
Aggiornato Dual Timeframe Stochastic Momentum Index w/buy sell signals
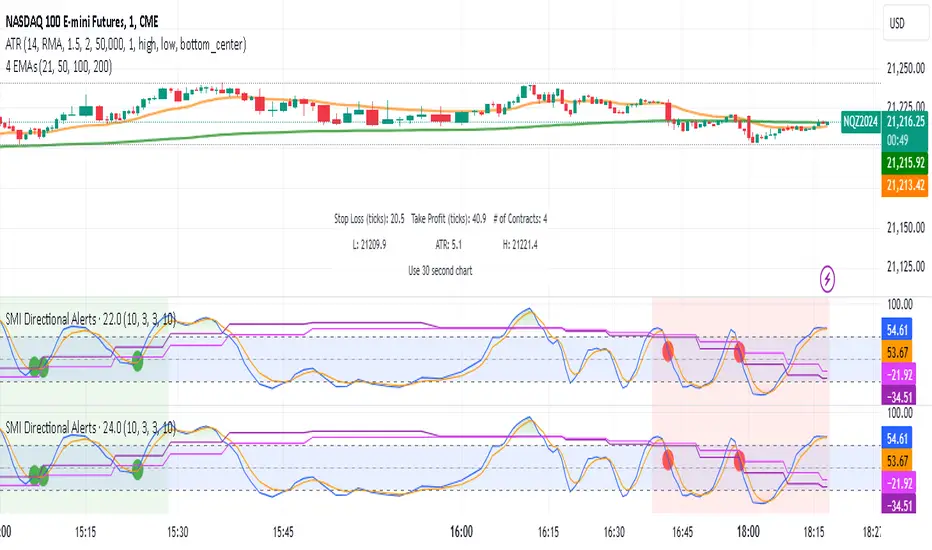
This indicator combines momentum analysis across two timeframes to identify high-probability trading opportunities. It plots the Stochastic Momentum Index (SMI) for both the chart timeframe and a higher timeframe (default 10 minutes) to help traders align with the broader market trend.
Key Features
Displays SMI and its EMA for both timeframes
Background shading indicates favorable trading conditions
Signal dots mark potential entry points
Customizable parameters for fine-tuning
Signals Explained
Bullish Signals (Green Dots)
Appear when the chart timeframe SMI crosses above its EMA
Only trigger during periods when the higher timeframe shows:
SMI is above its EMA (increasing momentum)
SMI is between -40 and +40 (not overbought/oversold)
Bearish Signals (Red Dots)
Appear when the chart timeframe SMI crosses below its EMA
Only trigger during periods when the higher timeframe shows:
SMI is below its EMA (decreasing momentum)
SMI is between -40 and +40 (not overbought/oversold)
Settings
%K Length: Lookback period for SMI calculation (default: 10)
%D Length: Smoothing period for primary calculation (default: 3)
EMA Length: Smoothing period for signal line (default: 3)
Alternative Timeframe: Higher timeframe for trend analysis (default: 10 minutes)
Best Practices
Use higher timeframe signals to determine market bias
Wait for signal dots in the chart timeframe for entry timing
Avoid trades when higher timeframe SMI is in extreme zones (above 40 or below -40)
Consider additional confirmation from price action or other indicators
Note: This indicator combines trend and momentum analysis but should be used as part of a complete trading strategy that includes proper risk management.
Note di rilascio
Updated script to include alert conditions for the following:Alert for Bullish Neutral Zone: Triggers when the higher timeframe SMI is above its EMA and within the neutral zone (-40 to +40).
Alert for Bearish Neutral Zone: Triggers when the higher timeframe SMI is below its EMA and within the neutral zone (-40 to +40).
Alerts for Crossovers: Triggers when the SMI crosses above or below its EMA.
Note di rilascio
Corrected the SMI crossover alert conditions so alerts only trigger when higher timeframe conditions are metNote di rilascio
Bullish Crossover Alert: Triggered when:The current SMI crosses above its EMA.
The higher timeframe shows SMI is above its EMA and in the neutral zone (-40 to +40).
Bearish Crossover Alert: Triggered when:
The current SMI crosses below its EMA.
The higher timeframe shows SMI is below its EMA and in the neutral zone (-40 to +40).
Note di rilascio
fixed background shadingScript open-source
Nello spirito di TradingView, l'autore di questo script lo ha reso open source, in modo che i trader possano esaminarne e verificarne la funzionalità. Complimenti all'autore! Sebbene sia possibile utilizzarlo gratuitamente, ricordiamo che la ripubblicazione del codice è soggetta al nostro Regolamento.
Declinazione di responsabilità
Le informazioni e le pubblicazioni non sono intese come, e non costituiscono, consulenza o raccomandazioni finanziarie, di investimento, di trading o di altro tipo fornite o approvate da TradingView. Per ulteriori informazioni, consultare i Termini di utilizzo.
Script open-source
Nello spirito di TradingView, l'autore di questo script lo ha reso open source, in modo che i trader possano esaminarne e verificarne la funzionalità. Complimenti all'autore! Sebbene sia possibile utilizzarlo gratuitamente, ricordiamo che la ripubblicazione del codice è soggetta al nostro Regolamento.
Declinazione di responsabilità
Le informazioni e le pubblicazioni non sono intese come, e non costituiscono, consulenza o raccomandazioni finanziarie, di investimento, di trading o di altro tipo fornite o approvate da TradingView. Per ulteriori informazioni, consultare i Termini di utilizzo.