OPEN-SOURCE SCRIPT
Aggiornato Deviation over Deviation (DoD)
(DAFE) Deviation over Deviation (DoD)
Let’s call it out: The vast majority of “volatility” tools on TradingView are just new wrappers on old math—ATR, bands, and basic deviation, all chasing the same tired after-the-fact moves. They’re built to describe the aftermath, not the ignition. If you’re still relying on these, you’re trading in the rearview mirror while the real edge is already gone. That’s not our game, and it shouldn’t be yours.
Deviation over Deviation (DoD) is built for one purpose:
To expose the hidden regime shifts—the moments when volatility itself becomes volatile, when the market’s “normal” deviation is no longer normal, and when the next move is about to erupt. This isn’t just another overlay. This is a quant-grade anomaly detector, engineered to show you the probability surface before the crowd even knows it’s changed.
What sets this apart:
Deviation over Deviation (DoD):
Not just “how much did price move,” but “how unusual is the current volatility compared to its own history?” This is the Z-score of Z-scores—a true rarity detector for market stress, lull, or impending breakout.
VoVix Integration:
Select VoVix as your source and you’re not just tracking price, but the volatility of volatility—the same math that powers institutional regime models. This is the edge that front-runs the move, not follows it.
Multi-Timeframe Comparative Engine:
Instantly compare current and higher timeframe DoD Z-scores. See when the micro and macro regimes align—or when they’re about to collide.
Professional, Adaptive Dashboard:
No cosmetic fluff, always showing you the real quant state: current DoD Z, HTF DoD Z, and regime warnings. Every color, every plot, every signal is a direct function of the logic—no distractions, no lag.
How this destroys the lag:
Standard deviation, ATR, and “volatility bands” are always late. They tell you what just happened. DoD and VoVix show you when the nature of volatility itself is changing—when the market is about to leave the old regime behind. This is the difference between trading the past and trading the future.
Inputs/Signals—explained for clarity:
Deviation Lookback & DoD Lookback:
Control the sensitivity and selectivity of the regime detector. Shorter = more signals, longer = only the rarest events.
Source Selection:
Choose from price, volume, volatility, or VoVix. Each source gives you a different lens on market stress. VoVix is for those who want to see the “regime quake” before the aftershocks.
HTF (Comparative Timeframe):
Set your higher timeframe for macro regime confirmation. When both DoD Z-scores align, you’re seeing a true market inflection.
VoVix Parameters:
Fine-tune the volatility-of-volatility engine for your market. Lower ATR Fast = more responsive; higher ATR Slow = more selective. Adjust for your asset, your timeframe, your edge.
Bottom line:
This isn’t just another “volatility” script. This is a regime anomaly detector, built for traders who want to anticipate, not react. Every input is there for a reason. Every plot is a direct readout of the quant logic. Use it to filter your entries, to time your exits, or to simply see the market’s hidden structure in real time.
Disclaimer:
Trading is risky. This script is for research and informational purposes only, not financial advice. Backtest, paper trade, and know your risk before going live. Past performance is not a guarantee of future results.
*Updated the Dashboard/Metrics Display for better visibility
Use with discipline. Trade your edge.
— Dskyz, for DAFE Trading Systems
Note di rilascio
Deviation over Deviation (DoD)What makes this script original?
Deviation over Deviation (DoD) applies a Z-score calculation to the standard deviation itself, not just price. This highlights rare volatility regime shifts that standard indicators miss. By optionally using VoVix (volatility-of-volatility) as the source, you can detect when volatility itself is becoming unusually volatile—a unique quant edge. The multi-timeframe engine lets you confirm when both micro and macro volatility regimes align, providing advanced anticipation of market inflections.
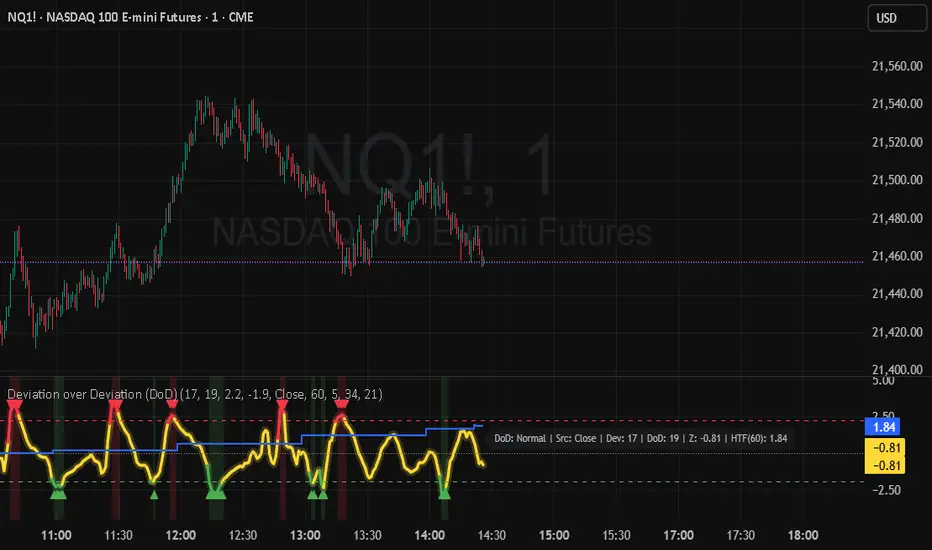
How does it work?
DoD Z-score Line: Shows how unusual current volatility is compared to its own history.
Color Coding: Red for rare high volatility, green for rare low volatility, yellow for normal.
Background Highlights: Emphasize rare high/low volatility events.
Triangle Markers: Appear at rare high/low events for easy spotting.
HTF DoD Z-score: Lets you compare current and higher timeframe regimes for confirmation.
Info Label: Compact dashboard shows regime, source, and all key parameters.
How to use:
Apply to any liquid asset (e.g., ES, NQ, BTC) on your preferred timeframe.
Select your source: price, volume, volatility, or VoVix for advanced regime detection.
Watch for the DoD Z-score line crossing above/below the high/low thresholds—these indicate rare volatility events.
-Use the background highlights and triangle markers to filter trades or time entries/exits.
Compare the main and HTF DoD Z-scores for multi-timeframe confirmation of regime shifts.
Adjust the lookback and thresholds to match your asset and trading style.
Inputs:
Deviation Lookback: Number of bars for standard deviation calculation.
DoD Lookback: Number of bars for moving average and stdev of deviation.
High/Low DoD Z-Score Thresholds: Levels for detecting rare high/low volatility events.
Source: Choose from price, volume, volatility, or VoVix.
Comparative (HTF) Timeframe: Higher timeframe for macro regime confirmation.
VoVix Parameters: Fine-tune the volatility-of-volatility engine.
Show Info Label: Toggle for a compact dashboard.
Chart Info:
Script name: “Deviation over Deviation (DoD)”
Recommended for ES, NQ, BTC, or other liquid assets.
Works on any timeframe; best results on 1m–15m for intraday, or 1h–4h for swing trading.
Note:
Triangle markers and background highlights indicate rare volatility regime shifts, not direct buy or sell signals. Use as informational alerts or filters within your own strategy.
Disclaimer:
This script is for research and informational purposes only, not financial advice. Trading is risky—backtest, paper trade, and know your risk before going live. Past performance is not a guarantee of future results.
Release Notes:
Updated dashboard/metrics display for better visibility.
Info label now shows regime, source, and all key parameters at a glance.
Script open-source
Nello spirito di TradingView, l'autore di questo script lo ha reso open source, in modo che i trader possano esaminarne e verificarne la funzionalità. Complimenti all'autore! Sebbene sia possibile utilizzarlo gratuitamente, ricordiamo che la ripubblicazione del codice è soggetta al nostro Regolamento.
Empowering everyday traders and DAFE Trading Systems
DAFETradingSystems.com
DAFETradingSystems.com
Declinazione di responsabilità
Le informazioni e le pubblicazioni non sono intese come, e non costituiscono, consulenza o raccomandazioni finanziarie, di investimento, di trading o di altro tipo fornite o approvate da TradingView. Per ulteriori informazioni, consultare i Termini di utilizzo.