OPEN-SOURCE SCRIPT
Pivot trend indicator
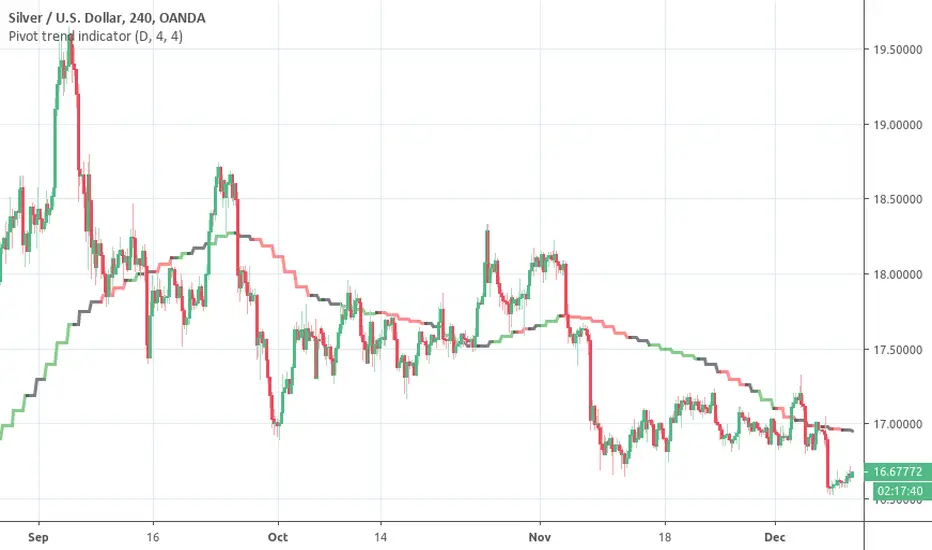
This is a LAGGING indicator which can provide a good indication of trend. It require a certain (configurable) number of candles to have closed before it can determine whether a pivot has formed.
It provides a 20 period SMA for the timeframe of your choice which is color coded to show the trend according to confirmed pivots.
Anticipated usage:
The SMA colors:
Why the 20 SMA?
Feel free to adjust it for your purposes. I personally find that using a higher time frame 20 SMA is a better indication of trend than longer period MAs on shorter time frames. This can be seen from comparing the 20 daily SMA and 200 hourly SMA.
Pivot adjustment
The pivots use the selected time frame (not) the MA trend time frame. You can specify the left and right candles required to confirm a pivot
It provides a 20 period SMA for the timeframe of your choice which is color coded to show the trend according to confirmed pivots.
Anticipated usage:
- Long / Short bias is determined by pivot trend
- Trader seeks entries according to their strategy
- Black consolidation areas may trigger a re-evaluation of the trade and can serve as good profit taking areas
The SMA colors:
- Green -> Higher highs & Higher lows
- Red -> Lower highs & Lowers lows
- Black -> No clear trend from the pivots
Why the 20 SMA?
Feel free to adjust it for your purposes. I personally find that using a higher time frame 20 SMA is a better indication of trend than longer period MAs on shorter time frames. This can be seen from comparing the 20 daily SMA and 200 hourly SMA.
Pivot adjustment
The pivots use the selected time frame (not) the MA trend time frame. You can specify the left and right candles required to confirm a pivot
Script open-source
Nello spirito di TradingView, l'autore di questo script lo ha reso open source, in modo che i trader possano esaminarne e verificarne la funzionalità. Complimenti all'autore! Sebbene sia possibile utilizzarlo gratuitamente, ricordiamo che la ripubblicazione del codice è soggetta al nostro Regolamento.
Declinazione di responsabilità
Le informazioni e le pubblicazioni non sono intese come, e non costituiscono, consulenza o raccomandazioni finanziarie, di investimento, di trading o di altro tipo fornite o approvate da TradingView. Per ulteriori informazioni, consultare i Termini di utilizzo.