PROTECTED SOURCE SCRIPT
Flunki ZWAPometer - ZWAP Resets / Extremes

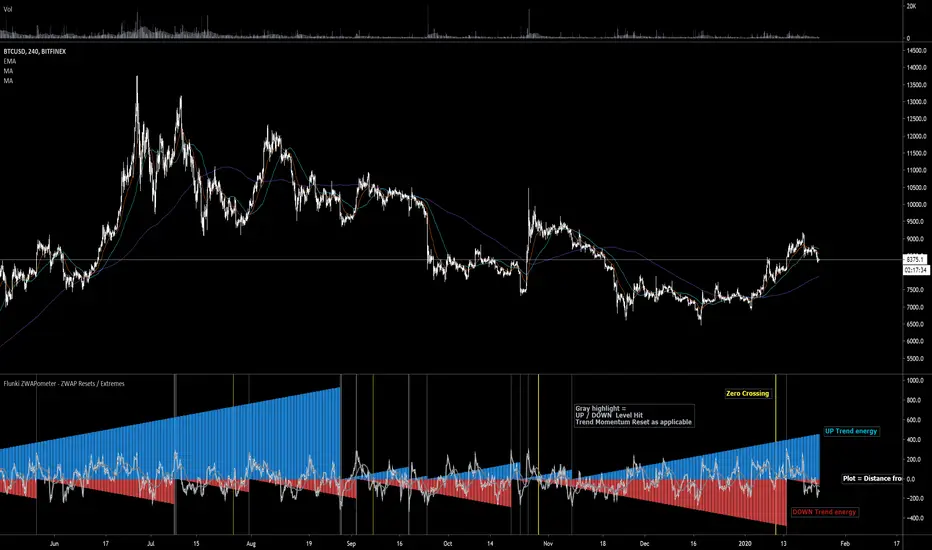
Here with another VWAP based indicator, this time using ZWAP (distance from VWAP) and flagging the extremities and crosses of each side, and graphing the bars since the last breach.
This basically gives a Bull / Bear energy / momentum
Yellow highlights = zero crossing , not entirely sure this is useful as of yet, but can give an early warning of a change - let me know if you find a genuine use for it !
Gray highlights = extreme reached, this generally signals exhaustion of the trend energy for Bull or Bear (depending on which side is reset obviously)
May develop further ; add bar colour options and more precise highlights, but only if it's of use to anyone.
Enjoy !
Flunkimoku
Script protetto
Questo script è pubblicato come codice protetto. Tuttavia, è possibile utilizzarle liberamente e senza alcuna limitazione – ulteriori informazioni qui.
Declinazione di responsabilità
Le informazioni e le pubblicazioni non sono intese come, e non costituiscono, consulenza o raccomandazioni finanziarie, di investimento, di trading o di altro tipo fornite o approvate da TradingView. Per ulteriori informazioni, consultare i Termini di utilizzo.