OPEN-SOURCE SCRIPT
Aggiornato Qualitative Smoothed Strength Index
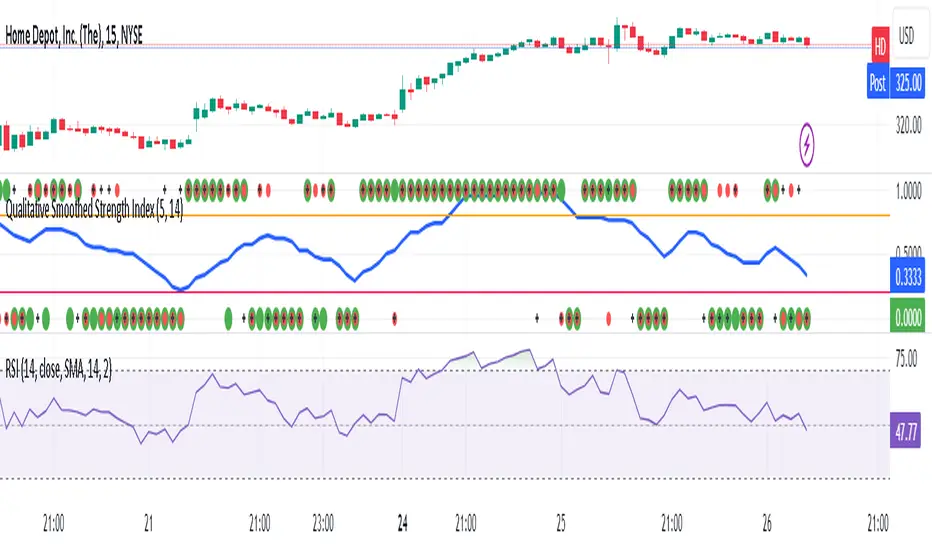
***RSI CHART BELOW IS FOR COMPARSION TO SHOW HOE THEY MAKE SIMILIAR PATTERNS*** IT IS NOT PART OF THE INDICATOR***
The Qualitative Smoothed Strength Index (QSSI) is a simplified momentum oscillator whose values will oscillate between 0 and 1 . By converting price differences into binary values and smoothing them with a moving average, it identifies qualitative strength of price movements. This simplification allows traders to easily interpret trends and reversals. The QSSI offers advantages such as noise reduction, clear trend identification, and early signal detection, resulting in less lag compared to traditional oscillators. Traders can customize the indicator based on their preferences and use it across various markets.
QSSI Indicator uses the input function is used to define the input parameters of the indicator. In this case, there are two inputs:
length: The number of periods used for calculating the differences (a, b, c) and their assigned values. Default value is 5.
MAL: The length of the moving average used for smoothing the assigned values. Default value is 14.
The next few lines calculate 'a', 'b', and 'c', which represent the differences between the high, low, and close prices, respectively, and their corresponding previous simple moving averages (SMAs) of specified length. These differences are used to identify price movements.
The code assigns binary values (0 or 1) to a_assigned, b_assigned, and c_assigned, depending on whether the corresponding differences (a, b, c) are greater than 0. This step converts the differences into a binary representation, indicating upward or downward price movements.
Average_assigned calculates the average of the assigned binary values of a, b, and c. This average value represents the overall strength of the price movement.ma_assigned calculates the 14-day moving average of average_assigned, which smoothens the indicator and helps traders identify trends more easily.
The code plots the 14-day moving average (ma_assigned) on the chart as a blue line. It also plots the individual assigned values of a, b, and c as dots on the chart. a_assigned is shown in green, b_assigned in red, and c_assigned in black. These dots indicate the presence of upward or downward movements in the respective price components. By visualizing these dots on the chart, the trader can quickly identify the presence and direction of price movements for each of the price components. This information can be valuable for understanding how the different price elements (high, low, and close) are contributing to the overall trend and strength of the market. Traders can use this data to make more informed decisions, such as confirming the presence of trends, identifying potential reversals, or gauging the overall market sentiment based on the distribution of upward and downward movements across the price components.
Finally, the code draws horizontal dotted lines at levels 0.70 (0.8)and 0.30 (0.2). These levels are typically used to identify overbought (above 0.70 or 0.8) and oversold (below 0.30 or 0.2) conditions in the market.
The Qualitative Smoothed Strength Index (QSSI) provides traders with information about the strength and direction of price movements. By using assigned binary values, the indicator simplifies the interpretation of price data, making it easier to identify trends and potential reversals.
Note di rilascio
minor updates to labels and colors Script open-source
Nello spirito di TradingView, l'autore di questo script lo ha reso open source, in modo che i trader possano esaminarne e verificarne la funzionalità. Complimenti all'autore! Sebbene sia possibile utilizzarlo gratuitamente, ricordiamo che la ripubblicazione del codice è soggetta al nostro Regolamento.
Declinazione di responsabilità
Le informazioni e le pubblicazioni non sono intese come, e non costituiscono, consulenza o raccomandazioni finanziarie, di investimento, di trading o di altro tipo fornite o approvate da TradingView. Per ulteriori informazioni, consultare i Termini di utilizzo.
Script open-source
Nello spirito di TradingView, l'autore di questo script lo ha reso open source, in modo che i trader possano esaminarne e verificarne la funzionalità. Complimenti all'autore! Sebbene sia possibile utilizzarlo gratuitamente, ricordiamo che la ripubblicazione del codice è soggetta al nostro Regolamento.
Declinazione di responsabilità
Le informazioni e le pubblicazioni non sono intese come, e non costituiscono, consulenza o raccomandazioni finanziarie, di investimento, di trading o di altro tipo fornite o approvate da TradingView. Per ulteriori informazioni, consultare i Termini di utilizzo.