OPEN-SOURCE SCRIPT
Aggiornato Adaptive Fisherized ROC
Introduction
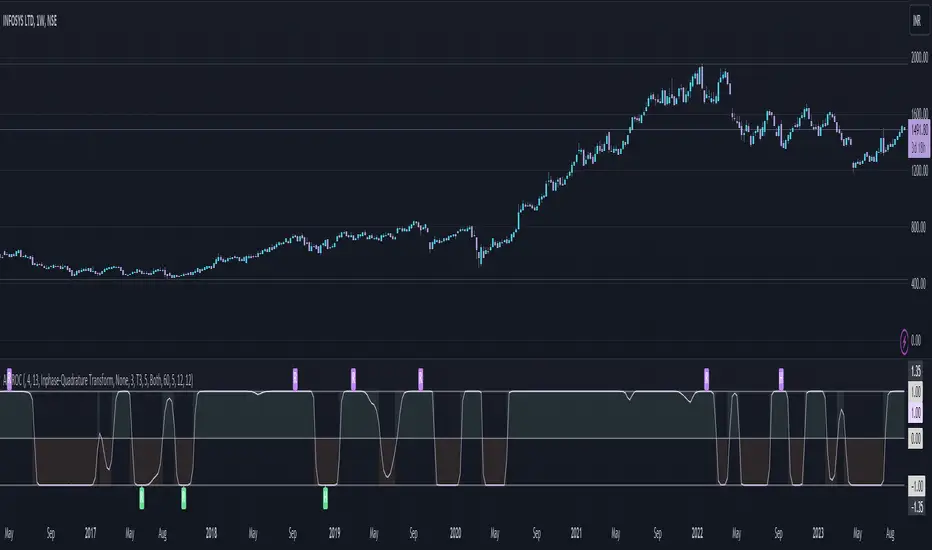
Hello community, here I applied the Inverse Fisher Transform, Ehlers dominant cycle determination and smoothing methods on a simple Rate of Change (ROC) indicator
You have a lot of options to adjust the indicator.
Usage
The rate of change is most often used to measure the change in a security's price over time.
That's why it is a momentum indicator.
When it is positive, prices are accelerating upward; when negative, downward.
It is useable on every timeframe and could be a potential filter for you your trading system.
IMO it could help you to confirm entries or find exits (e.g. you have a long open, roc goes negative, you exit).
If you use a trend-following strategy, you could maybe look out for red zones in an in uptrend or green zones in a downtrend to confirm your entry on a pullback.
Signals
ROC above 0 => confirms bullish trend
ROC below 0 => confirms bearish trend
ROC hovers near 0 => price is consolidating
Enjoy! 🚀
Note di rilascio
Updated default valuesFixed hilber transform calculation bug
Note di rilascio
Updated default valuesAdded min length check
Fixed Inphase-Quadrature Transform calculation
Fixed adaptive mode selection bug
Note di rilascio
Decreased lag of Hann Window smoothing by applying it to the price instead of the indicator itself.Increased linewidth and decreased transparency on background colors
Note di rilascio
Updated plotNote di rilascio
Just to update the chartNote di rilascio
- Added divergence detection
- Removed wrong Kalman filter
- Reworked smoothing system -> Now you can apply the smoothing methods on the source price (which is close[1]) or on the indicator itself depending on what your goal is with the smoothing.
Note di rilascio
Applied the IFT after the smoothing to stick to the scale of -1 to 1Note di rilascio
Removed 34 as max length of Homodyne DiscriminatorNote di rilascio
Fixed that T3 Normal wasn't selectale.Script open-source
In pieno spirito TradingView, il creatore di questo script lo ha reso open-source, in modo che i trader possano esaminarlo e verificarne la funzionalità. Complimenti all'autore! Sebbene sia possibile utilizzarlo gratuitamente, ricorda che la ripubblicazione del codice è soggetta al nostro Regolamento.
Declinazione di responsabilità
Le informazioni ed i contenuti pubblicati non costituiscono in alcun modo una sollecitazione ad investire o ad operare nei mercati finanziari. Non sono inoltre fornite o supportate da TradingView. Maggiori dettagli nelle Condizioni d'uso.
Script open-source
In pieno spirito TradingView, il creatore di questo script lo ha reso open-source, in modo che i trader possano esaminarlo e verificarne la funzionalità. Complimenti all'autore! Sebbene sia possibile utilizzarlo gratuitamente, ricorda che la ripubblicazione del codice è soggetta al nostro Regolamento.
Declinazione di responsabilità
Le informazioni ed i contenuti pubblicati non costituiscono in alcun modo una sollecitazione ad investire o ad operare nei mercati finanziari. Non sono inoltre fornite o supportate da TradingView. Maggiori dettagli nelle Condizioni d'uso.