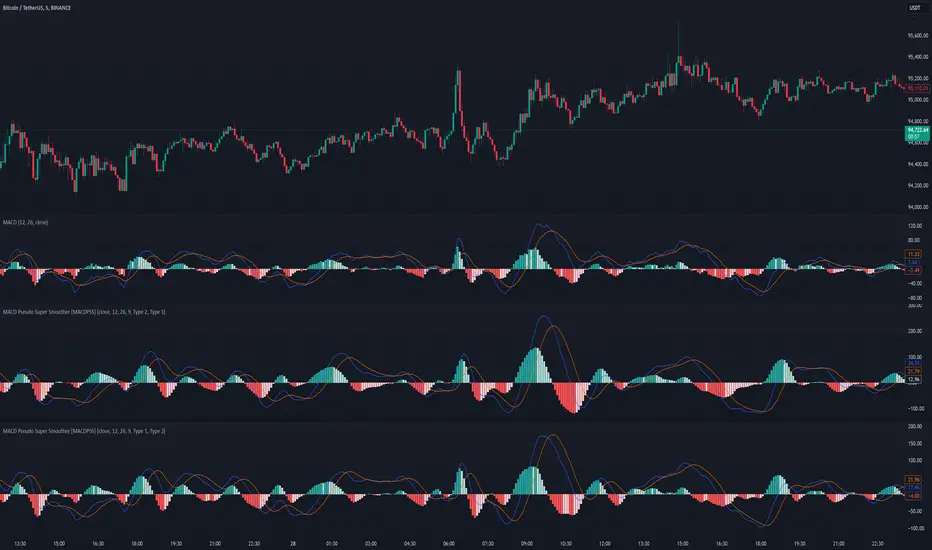
MACD Pseudo Super Smoother [MACDPSS]The MACD Pseudo Super Smoother (MACDPSS) is a variation of the classic Moving Average Convergence Divergence (MACD) indicator. It utilizes the Pseudo Super Smoother (PSS) filter, a Finite Impulse Response (FIR) filter, to smooth both the MACD line and the signal line, providing a potentially refined representation of momentum compared to the traditional MACD which typically uses Exponential Moving Averages (EMAs).
The PSS, inspired by the Super Smoother filter (an Infinite Impulse Response (IIR) filter), aims to reduce noise while minimizing lag. The MACDPSS leverages this FIR implementation to create a unique MACD variant. The core concept of MACD, which involves analyzing the relationship between two moving averages of different lengths to identify momentum shifts, remains intact.
Filter Types and Customization
The MACDPSS offers independent control over the smoothing applied to the MACD line and the signal line through two "Filter Style" inputs:
Oscillator MA Type: This setting determines the filter type used to calculate the fast and slow moving averages that form the basis of the MACD line.
Signal Line MA Type: This setting controls the filter type used to smooth the MACD line, generating the signal line.
Each of these settings allows a choice between two distinct PSS filter types:
Type 1: Provides a smoother output with a more gradual response, characterized by greater attenuation of high-frequency components.
Type 2: Exhibits increased reactivity, allowing for a faster response to shifts in momentum, but with a potential for overshoot.
This dual-filter approach provides flexibility in tailoring the indicator's responsiveness and smoothness to individual preferences and specific market conditions. The user can, for example, choose a smoother Type 1 filter for the MACD line and a more reactive Type 2 filter for the signal line, or vice-versa.
Calculations
The MACDPSS calculates the MACD line by subtracting the slow moving average from the fast moving average, both derived using the PSS filter with the selected "Oscillator MA Type." The signal line is then calculated by applying the PSS filter with the selected "Signal Line MA Type" to the MACD line. The histogram represents the difference between the MACD line and the signal line.
Interpretation
The interpretation of the MACDPSS is similar to the standard MACD. Crossovers between the MACD line and the signal line, the position of the MACD line relative to the zero line, and the slope and direction of the histogram are all used to gauge momentum and potential trend changes.
Disclaimer
The MACDPSS, while inspired by the Super Smoother, utilizes a distinct FIR approximation (the PSS). Therefore, its behavior will not perfectly mirror that of a MACD calculated using IIR filters. The PSS is designed to be a rough approximation. This indicator should be used in conjunction with other technical analysis tools, and users should be aware of the inherent differences between FIR and IIR filter characteristics when interpreting the indicator's signals. Like any moving average based indicator, the MACDPSS is a lagging indicator, although it tries to improve it. The novelty of this indicator comes from applying a unique FIR filter to a classic momentum oscillator in a configurable way.
Ehler
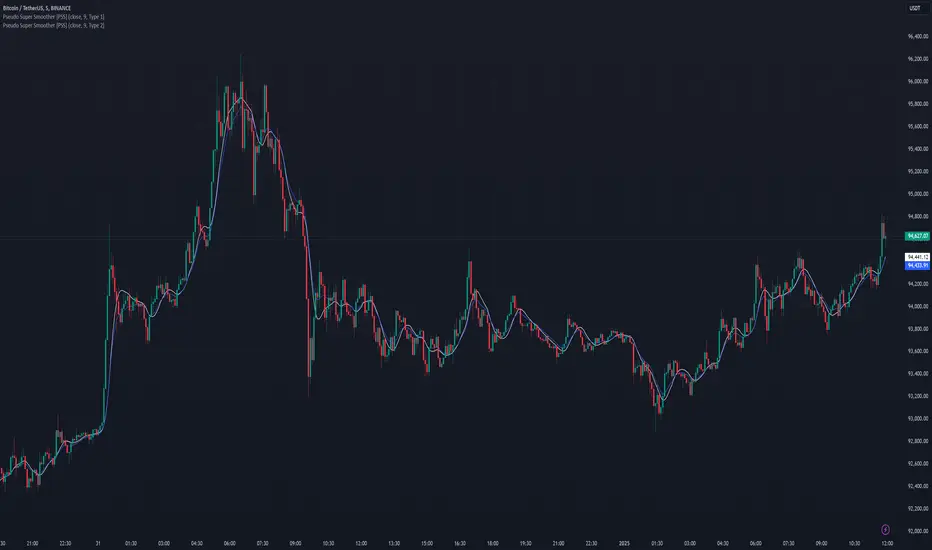
Pseudo Super Smoother [PSS]The Pseudo Super Smoother (PSS) is a a Finite Impulse Response (FIR) filter. It provides a smoothed representation of the underlying data. This indicator can be considered a variation of a moving average, offering a unique approach to filtering price or other data series.
The PSS is inspired by the Super Smoother filter, known for its ability to reduce noise while maintaining a relatively low delay. However, the Super Smoother is an Infinite Impulse Response (IIR) filter. The PSS attempts to approximate some characteristics of the Super Smoother using an FIR design, which offers inherent stability.
The indicator offers two distinct filter types, selectable via the "Filter Style" input: Type 1 and Type 2 . Type 1 provides a smoother output with a more gradual response to changes in the input data. It is characterized by a greater attenuation of high-frequency components. Type 2 exhibits increased reactivity compared to Type 1 , allowing for a faster response to shifts in the underlying data trend, albeit with a potential overshoot. The choice between these two types will depend on the specific application and the preference for responsiveness versus smoothness.
The PSS calculates the FIR filter coefficients based on a decaying exponential function, adjusted according to the selected filter type and the user-defined period. The filter then applies these coefficients to a window of past data, effectively creating a weighted average that emphasizes more recent data points to varying degrees. The PSS uses a specific initialization technique that uses the first non-null data point to pre-fill the input window, which helps it start right away.
The PSS is an approximation of the Super Smoother filter using an FIR design. While it try's to emulate some of the Super Smoother's smoothing characteristics, users should be aware that the frequency response and overall behavior will differ due to it being a rough approximation. The PSS should be considered an experimental indicator and used in conjunction with other analysis techniques. This is, effectively, just another moving average, but its novelty lies in its attempt to bridge the gap between FIR and IIR filter designs for a specific smoothing goal.
Ultimate Bands [BigBeluga]Ultimate Bands
The Ultimate Bands indicator is an advanced technical analysis tool that combines elements of volatility bands, oscillators, and trend analysis. It provides traders with a comprehensive view of market conditions, including trend direction, momentum, and potential reversal points.
🔵 KEY FEATURES
● Ultimate Bands
Consists of an upper band, lower band, and a smooth middle line
Based on John Ehler's SuperSmoother algorithm for reduced lag
Bands are calculated using Root Mean Square Deviation (RMSD) for adaptive volatility measurement
Helps identify potential support and resistance levels
● Ultimate Oscillator
Derived from the price position relative to the Ultimate Bands
Oscillates between overbought and oversold levels
Provides insights into potential reversals and trend strength
● Trend Signal Line
Based on a Hull Moving Average (HMA) of the Ultimate Oscillator
Helps identify the overall trend direction
Color-coded for easy trend interpretation
● Heatmap Visualization
Displays the current state of the oscillator and trend signal
Provides an intuitive visual representation of market conditions
Shows overbought/oversold status and trend direction at a glance
● Breakout Signals
Optional feature to detect and display breakouts beyond the Ultimate Bands
Helps identify potential trend reversals or continuations
Visualized with arrows on the chart and color-coded candles
🔵 HOW TO USE
● Trend Identification
Use the color and position of the Trend Signal Line to determine the overall market trend
Refer to the heatmap for a quick visual confirmation of trend direction
● Entry Signals
Look for price touches or breaks of the Ultimate Bands for potential entry points
Use oscillator extremes in conjunction with band touches for stronger signals
Consider breakout signals (if enabled) for trend-following entries
● Exit Signals
Use opposite band touches or breakouts as potential exit points
Monitor the oscillator for divergences or extreme readings as exit signals
● Overbought/Oversold Analysis
Use the Ultimate Oscillator and heatmap to identify overbought/oversold conditions
Look for potential reversals when the oscillator reaches extreme levels
● Confirmation
Combine Ultimate Bands, Oscillator, and Trend Signal for stronger trade confirmation
Use the heatmap for quick visual confirmation of market conditions
🔵 CUSTOMIZATION
The Ultimate Bands indicator offers several customization options:
Adjust the main calculation length for bands and oscillator
Modify the number of standard deviations for band calculation
Change the signal line length for trend analysis
Toggle the display of breakout signals and candle coloring
By fine-tuning these settings, traders can adapt the Ultimate Bands indicator to various market conditions and personal trading strategies.
The Ultimate Bands indicator provides a multi-faceted approach to market analysis, combining volatility-based bands, oscillator analysis, and trend identification in one comprehensive tool. Its adaptive nature and visual cues make it suitable for both novice and experienced traders across various timeframes and markets. The integration of multiple analytical elements offers traders a rich set of data points to inform their trading decisions.

Leading T3Hello Fellas,
Here, I applied a special technique of John F. Ehlers to make lagging indicators leading. The T3 itself is usually not realling the classic lagging indicator, so it is not really needed, but I still publish this indicator to demonstrate this technique of Ehlers applied on a simple indicator.
The indicator does not repaint.
In the following picture you can see a comparison of normal T3 (purple) compared to a 2-bar "leading" T3 (gradient):
The range of the gradient is:
Bottom Value: the lowest slope of the last 100 bars -> green
Top Value: the highest slope of the last 100 bars -> purple
Ehlers Special Technique
John Ehlers did develop methods to make lagging indicators leading or predictive. One of these methods is the Predictive Moving Average, which he introduced in his book “Rocket Science for Traders”. The concept is to take a difference of a lagging line from the original function to produce a leading function.
The idea is to extend this concept to moving averages. If you take a 7-bar Weighted Moving Average (WMA) of prices, that average lags the prices by 2 bars. If you take a 7-bar WMA of the first average, this second average is delayed another 2 bars. If you take the difference between the two averages and add that difference to the first average, the result should be a smoothed line of the original price function with no lag.
T3
To compute the T3 moving average, it involves a triple smoothing process using exponential moving averages. Here's how it works:
Calculate the first exponential moving average (EMA1) of the price data over a specific period 'n.'
Calculate the second exponential moving average (EMA2) of EMA1 using the same period 'n.'
Calculate the third exponential moving average (EMA3) of EMA2 using the same period 'n.'
The formula for the T3 moving average is as follows:
T3 = 3 * (EMA1) - 3 * (EMA2) + (EMA3)
By applying this triple smoothing process, the T3 moving average is intended to offer reduced noise and improved responsiveness to price trends. It achieves this by incorporating multiple time frames of the exponential moving averages, resulting in a more accurate representation of the underlying price action.
Thanks for checking this out and give a boost, if you enjoyed the content.
Best regards,
simwai
---
Credits to @loxx

Triple Ehlers Market StateClear trend identification is an important aspect of finding the right side to trade, another is getting the best buying/selling price on a pullback, retracement or reversal. Triple Ehlers Market State can do both.
Three is always better
Ehlers’ original formulation produces bullish, bearish and trendless signals. The indicator presented here gate stages three correlation cycles of adjustable lengths and degree thresholds, displaying a more refined view of bullish, bearish and trendless markets, in a compact and novel way.
Stick with the default settings, or experiment with the cycle period and threshold angle of each cycle, then choose whether ‘Recent trend weighting’ is included in candle colouring.
John Ehlers is a highly respected trading maths head who may need no introduction here. His idea for Market State was published in TASC June 2020 Traders Tips. The awesome interpretation of Ehlers’ work on which Triple Ehlers Market State’s correlation cycle calculations are based can be found at:
DISCLAIMER: None of this is financial advice.

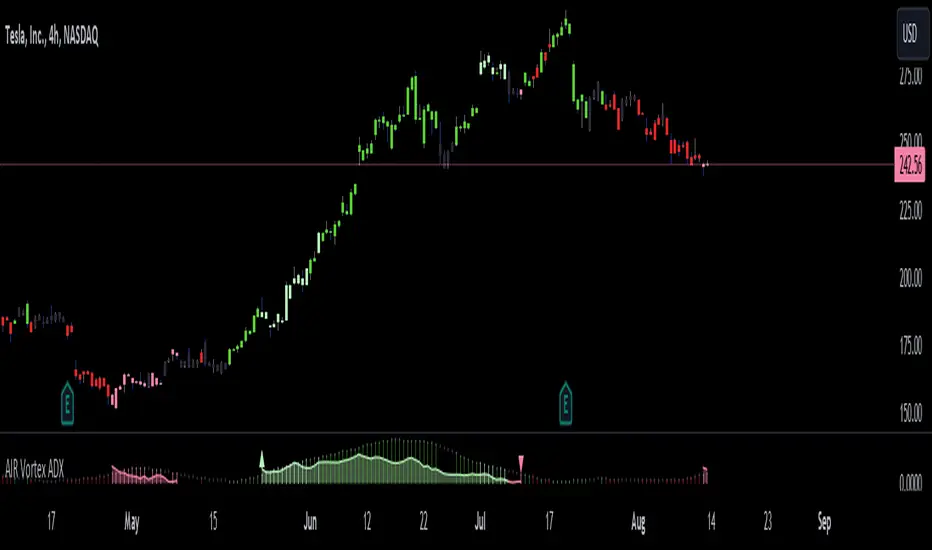
AIR Vortex ADXThis project started as an effort to improve the user interface of the hybrid indicator ADX of Vortex, which is, as per the name, a blend of ADX and Vortex Indicator. Plotting both indicators on the same polarity and normalising the vortex, a better interpretation of the interaction between the two is possible, and trend becomes apparent.
Basically, the Vortex provides the bright punch and ADX the continuation of the trend and momentum.
A range mixer has been added to the vortex, comprising both true and interpercentile ranges (see my previous script for a desrciption of interpercentile range). Users can activate and add amounts of each as they see fit.
Finally, there is an RSI filter, the idea of which is to filter out ranging (flat) markets, where no distinct direction is yet emerging.
Ehlers Stochastic Center Of Gravity [CC]The Stochastic Center Of Gravity Indicator was created by John Ehlers (Cybernetic Analysis For Stocks And Futures pgs 79-80), and this is one of the many cycle scripts that I have created but not published yet because, to be honest, I don't use cycle indicators in my everyday trading. Many of you probably do, so I will start publishing my big backlog of cycle-based indicators. These indicators work best with a trend confirmation or some other confirmation indicator to pair with it. The current cycle is the length of the trend, and since most stocks generally change their underlying trend quite often, especially during the day, it makes sense to adjust the length of this indicator to match the stock you are using it on. As you can see, the indicator gives constant buy and sell signals during a trend which is why I recommend using a confirmation indicator.
I have color-coded it to use lighter colors for normal signals and darker colors for strong signals. Buy when the line turns green and sell when it turns red.
Let me know if there are any other scripts you would like to see me publish!

Ehlers Detrending Filter [CC]The Detrending Filter was created by John Ehlers and this is a complementary indicator to one of my previous scripts:
This indicator builds upon his previous work by attempting to detrend the underlying source data that is used to calculate the final result. He was able to create a leading indicator by removing the trend data and by using his previous calculations to turn the source data into a leading indicator.
There are two ways to understand this indicator. First if the indicator is below the midline then it is in a mid to longterm downtrend and if it is above the midline then it is in a mid to longterm uptrend. Also this indicator shows great promise in predicting future trends so because of that aspect, it may give some false signals from time to time.
I have color coded everything to account for both strong signals and normal signals. Strong signals are darker in color and normal signals are lighter in color. Buy when the line turns green and sell when it turns red.
Let me know if there are any other scripts you would like to see me publish!

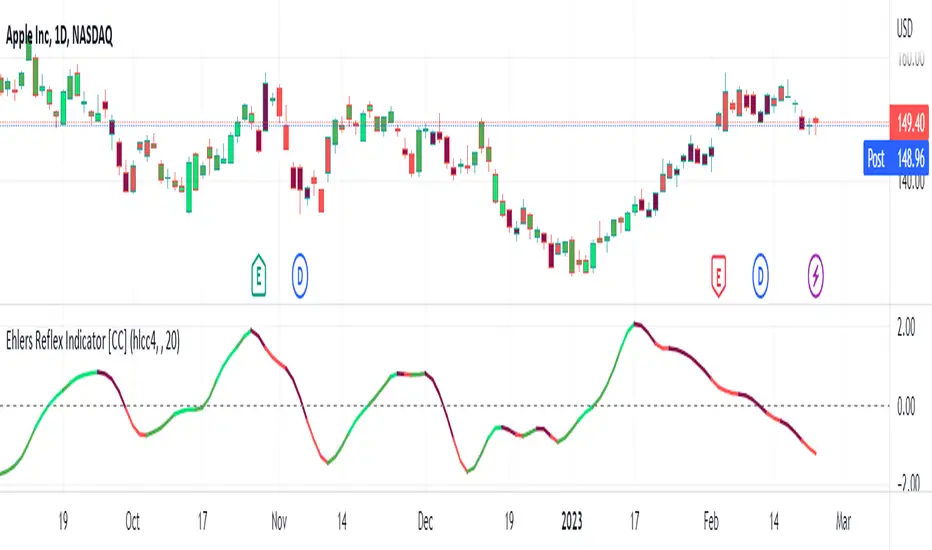
Ehlers Reflex Indicator [CC]The Reflex Indicator was created by John Ehlers (Stocks and Commodities Feb 2020) and this is a zero lag indicator that works similar to an overbought/oversold indicator but with the current stock cycle data. I find that this indicator works well as a leading indicator as well as a divergence indicator. Generally speaking, this indicator indicates a medium to long term downtrend when the indicator is below the line and a medium to long term uptrend when the indicator is above the line. Ehlers has created a few complementary indicators that I will release in the next few days but just keep in mind that this indicator focuses on the underlying cycle component while removing as much noise with no lag. I have color coded the lines to show strong signals with the darker colors and normal signals with the lighter colors. Buy when the line turns green and sell when it turns red.
Let me know if there are any other scripts you would like to see me publish!
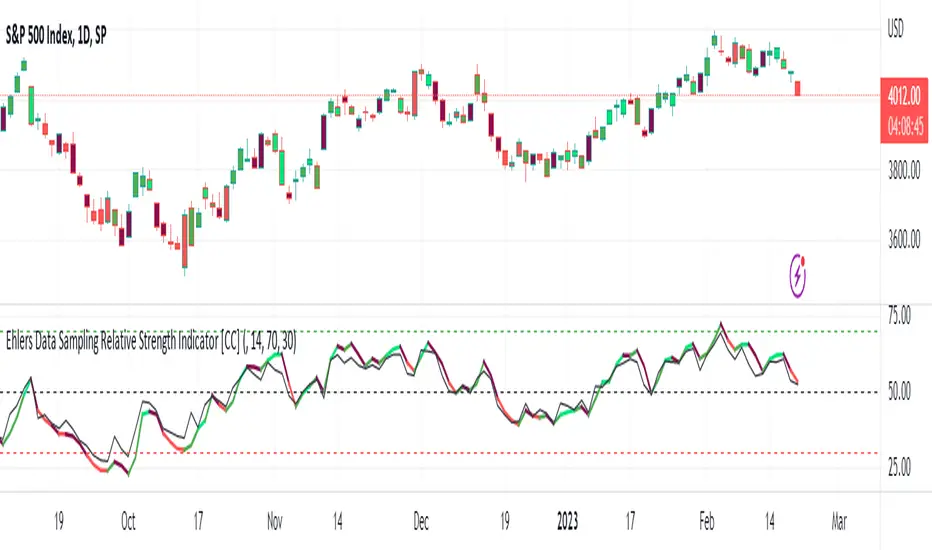
Ehlers Data Sampling Relative Strength Indicator [CC]The Data Sampling Indicator was created by John Ehlers (Stocks and Commodities Mar 2023) and this is a genius method to reduce noise in the market data but also doesn't introduce any lag while doing so. The way this works is because traditionally, people have always relied on the close price as the default input for many indicators such as the RSI or MACD as examples. Since the open is usually virtually identical to the previous close, it has been ignored by most people but Ehlers discovered that if you do a simple average of open and close for the input on any indicator, you can remove much of the noise without any added lag. I have used the RSI as he did in his example and plotted both to show the difference between the traditional RSI and using Ehlers' process as the new Data Sampling RSI. You can clearly see that this new RSI follows the price fluctuations much closer and is much smoother than the traditional RSI. As usual, I have included different colors to show the strength of the buy or sell signals so darker colors mean it is a very strong signal and lighter colors means it is a normal signal. Buy when the line turns green and sell when it turns red.
Feel free to try out this method to replace the input for any indicator and let me know how this works for you! And of course let me know if you would like me to publish any indicator script.
Adaptive Fisherized CMOIntroduction
Heyo, here is another no-repaint adaptive fisherized indicator.
I added Inverse Fisher Transform, Ehlers dominant cycle analysis and smoothing to the Chande Momentum Oscillator (CMO).
Usage
The CMO is a momentum oscillator which shows the usual movement of an asset.
I recommend to use it from a lower timeframe with a higher timeframe set.
Signals
(Signal mode will come soon.)
Zero Line
CMO crosses above zero line => enter long
CMO cross below zero line => ente short
Overbought/Oversold
CMO crosses above bottom band => enter long
CMO crosses under top band => enter short
MA (Maybe this signals will vary. Then, check update notes.)
CMO crosses above MA => enter long
CMO crosses below MA => enter short
Enjoy and share your experience with it!
More to read: CMO Explanationsp

Adaptive Fisherized KSTIntroduction
Heyo guys, here is a new adaptive fisherized indicator of me.
I applied Inverse Fisher Transform, Ehlers dominant cycle analysis,
smoothing and divergence analysis on the Know Sure Thing (KST) indicator.
Moreover, the indicator doesn't repaint.
Usage
I didn't backtest the indicator, but I recommend the 5–15 min timeframe.
It can be also used on other timeframs, but I have no experience with that.
The indicator has no special filter system, so you need to find an own combo in order to build a trading system.
A trend filter like KAMA or my Adaptive Fisherized Trend Intensity Index could fit well.
If you find a good combo, let me know it in the comments pls.
Signals
Zero Line
KST crossover 0 => Enter Long
KST crossunder 0 => Enter Short
Cross
KST crossover KST MA => Enter Long
KST crossunder KST MA => Enter Short
Cross Filtered
KST crossover KST MA and KST above 0 => Enter Long
KST crossunder KST MA and KST under 0 => Enter Short
KST crossunder 0 => Exit Long
KST crossover 0 => Exit Short
More to read: KST Explanation
Enjoy and let me know your opinion!
--
Credits to
- @tista
- @blackcat1402
- @DasanC
- @cheatcountry

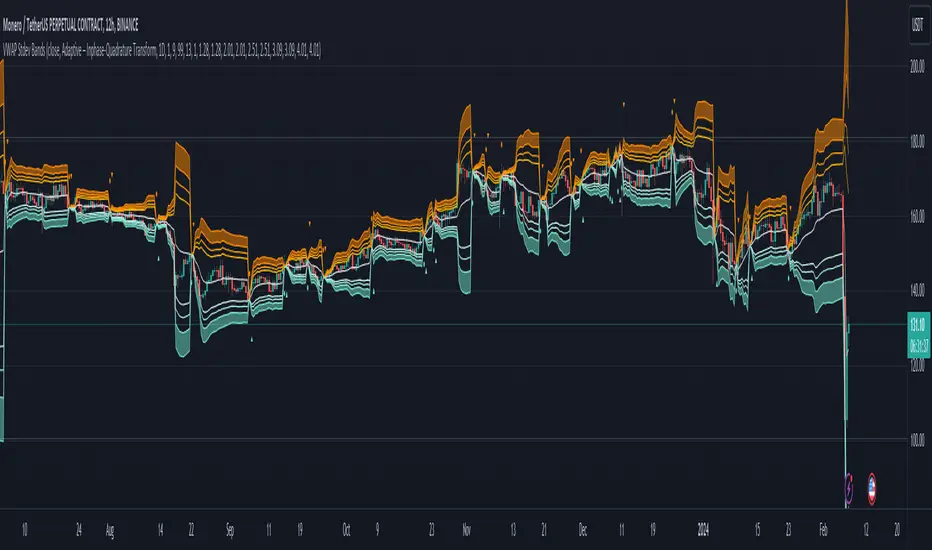
Adaptive VWAP Stdev BandsIntroduction
Heyo, here are some adaptive VWAP Standard Deviation Bands with nice colors.
I used Ehlers dominant cycle theories and ZLSMA smoothing to create this indicator.
You can choose between different algorithms to determine the dominant cycle and this will be used as reset period.
Everytime bar_index can be divided through the dominant cycle length and the result is zero VWAP resets if have chosen an adaptive mode in the settings.
The other reset event you can use is just a simple time-based event, e.g. reset every day.
Usage
I think people buy/sell when it reaches extreme zones.
Enjoy!
---
Credits to:
@SandroTurriate - VWAP Stdev Bands
@blackcat1402 - Dominant Cycle Analysis
@DasanC - Dominant Cycle Analysis
@veryfid - ZLSMA
(Sry, too lazy for linking)
I took parts of their code. Ty guys for your work! Just awesome.
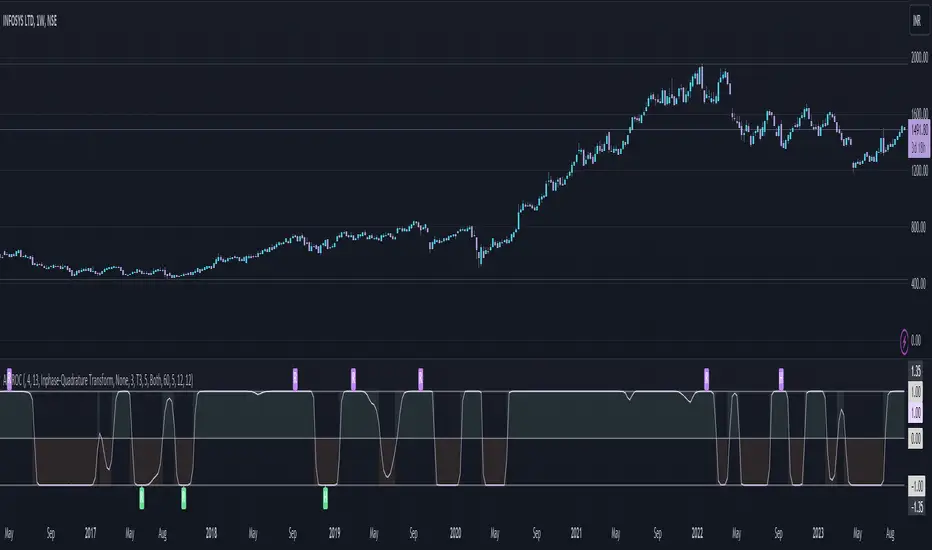
Adaptive Fisherized ROCIntroduction
Hello community, here I applied the Inverse Fisher Transform, Ehlers dominant cycle determination and smoothing methods on a simple Rate of Change (ROC) indicator
You have a lot of options to adjust the indicator.
Usage
The rate of change is most often used to measure the change in a security's price over time.
That's why it is a momentum indicator.
When it is positive, prices are accelerating upward; when negative, downward.
It is useable on every timeframe and could be a potential filter for you your trading system.
IMO it could help you to confirm entries or find exits (e.g. you have a long open, roc goes negative, you exit).
If you use a trend-following strategy, you could maybe look out for red zones in an in uptrend or green zones in a downtrend to confirm your entry on a pullback.
Signals
ROC above 0 => confirms bullish trend
ROC below 0 => confirms bearish trend
ROC hovers near 0 => price is consolidating
Enjoy! 🚀
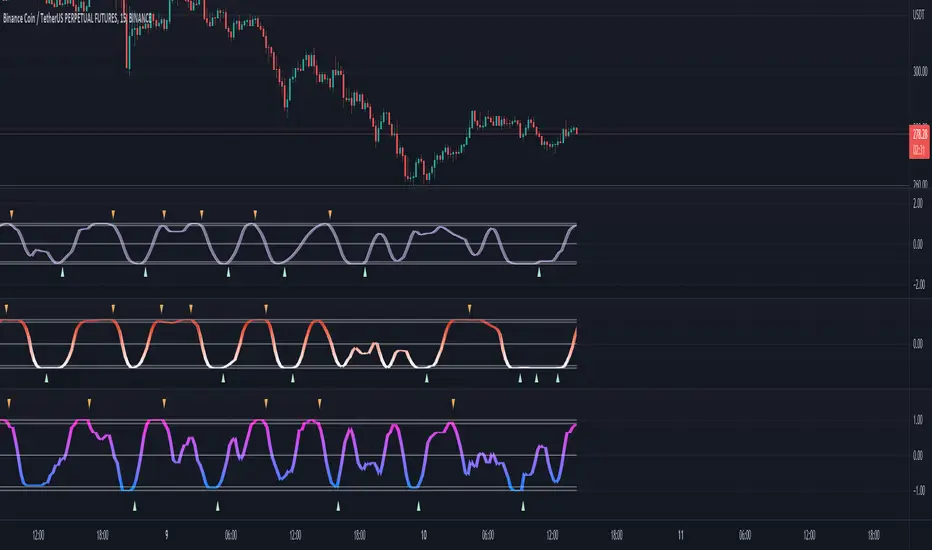
Adaptive Fisherized Stochastic Center of GravityIntroduction
I modified the script "Fisher Stochastic Center of Gravity" of @DasanC for this indicator.
I added inverse Fisher transform, cycle period adaptiveness mode (Ehlers) and smoothing to it.
Moreover, I added buy and sell and beautified some stuff.
Lastly, it is also non-repainting!
Usage
This indicator can be used like a normal stochastic, but I don't recommend divergence analysis on it.
That fisherization stuff seems to make the graphs unuseable for that because it tries.
It works well on every timeframe I would say, but lower timeframes are recommended, because of the fast nature of stochastic.
Usually it does a good job on entry confirmation for reversals and trend continuation trades.
Recommended indicator to combine with this indicator is RSI cyclic smoothed v2 .
This is the best RSI version I know. In trending market it is recommended to look more on the inner bands and in flat market it is recommended to look more on the outer bands.
When RSI shows oversold and this indicator shows a crossover of the Center of Gravity plot through the bottom line -> Long entry is confirmed
When RSI shows overbought and this indicator shows a crossunder of the Center of Gravity plot through the top line -> Short entry is confirmed
Settings
The adaptive mode is enabled by default to give you straight the whole indicator experience.
The default settings are optimized, but should be changed depending on the market.
An example:
Market has a low volatility and a high momentum -> I want a slower/higher length to catch the slower new highs and lows.
Market has higher volatility and a low momentum, -> I want a faster/lower length to catch the faster new highs and lows
Signals
Crossover
Buy -> cog crossover signalLine
Sell -> cog crossunder signalLine
Overbought/Oversold Crossover
Buy -> cog crossover lowerBand
Sell -> cog crossunder lowerBand
I use this indicator a lot, because I don't know a better stochastic on this community here.
@DasanC did an awesome work with his version I used as base for this script.
Enjoy this indicator and let the profit roll! 🔥
Fisherized CCIIntroduction
This here is a non-repainting indicator where I use inverse Fisher transformation and smoothing on the well-known CCI (Commdity Channel Index) momentum indicator.
"The Inverse Fisher Transform" describes the calculation and use of the inverse Fisher transform by Dr . Ehlers in 2004. The transform is applied to any indicator with a known probability distribution function. It enables to transform an indicator signal into the range between +1 and -1. This can help to eliminate the noise of an indicator.
The CCI is an momentum indicator which describes the distance of the price to the average price.
For smoothing I used the Hann Window and NET (Noise Elimination Technique) methods.
Additional Features
Divergence Analysis
Trend-adaptive Histogram
Timeframe selection
Usage
It is usually used to spot potential trend reverals or mean-reversion (against the trend) trades on lower timeframes. IMO it can be even used to spot trend-following trades. It always depends on which settings you have, which timeframe do you use and which indicators you combine with it.
The suggested timeframe for this indicator is 15 min (with the length setting on 50).
The histogram with adaptive mode enabled could be used as filter applied on the buy and sell signals.
The divergence analysis can help to spot additional entries/exits or confirm the buy and sell signals.
Always try to find the best settings! This indicators has a lot of customization options you should take advantage of.
Signals
The indicator uses the following logic to generate the buy and sell signals:
Normal
Buy -> When CCI and MA go above the top band (usually +100) and cross
Sell -> When CCI and MA go below the the bottom band (usually -100) and cross
Fisherized
Buy -> When CCI and MA go above the the zero line and cross
Sell -> When CCI and MA go below the the zero line and cross
Have fun with the indicator! I am open for feedback and questions. :)

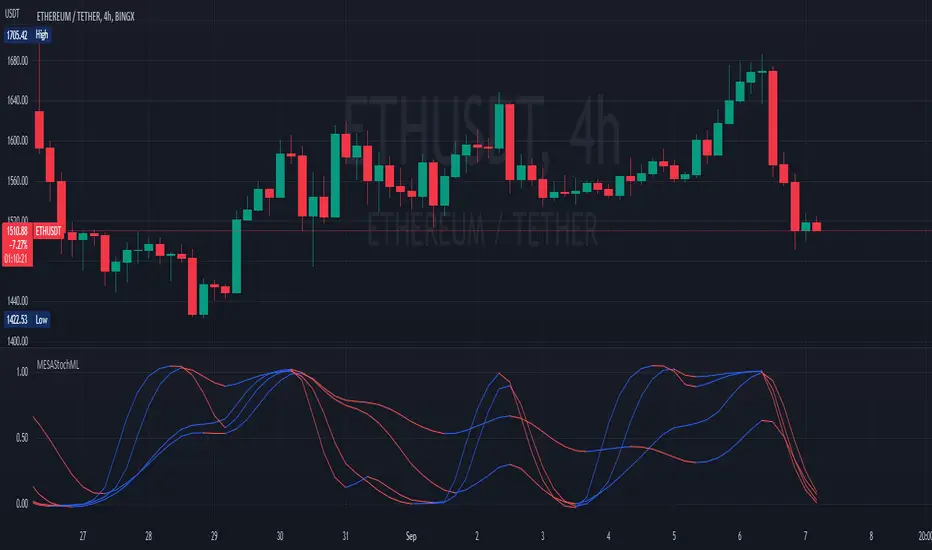
MESA Stochastic Multi LengthJohn Ehler's MESA Stochastic
It is updated and optimized version of script originally published by @veryfid.
Changes:
Converted to v5
Rewrote MESA Function. Same function can now calculate various length signals.
Modified super smoother. Indicator reacts faster to price change.
Optimized code. Functions are only called once per length.
Reverse Ehler Instantaneous Trendline - TraderHalaiThis script uses a reverse function of the famous Ehler Instantaneous Trendline to calculate the source price required in order to change from Bullish to bearish
From my analysis, the reverse price does appear to be rather choppy, though it is 100% accurate. This is because Ehler's Instantaneous Trendline tends to remain trending for longer periods of time with above average hold periods.
The main suitability for this would be higher level timeframes, such as Weekly, 5 daily, 3 daily. From my findings Smoothed Heikin Ashi Trend, tends to provide better risk-adjusted returns across most timeframes (Higher return to drawdown ratio)
As I have spent a bit of time getting the reverse function mathematics to work, I decided to publish this as open source for the benefit, scrutiny and for further development by the TradingView community anyways.
Enjoy!

Adaptive, Zero lag Schaff Trend Cycle [Loxx]TASC's March 2008 edition Traders' Tips includes an article by John Ehlers titled "Measuring Cycle Periods," and describes the use of bandpass filters to estimate the length, in bars, of the currently dominant price cycle.
What are Dominant Cycles and Why should we use them?
Even the most casual chart reader will be able to spot times when the market is cycling and other times when longer-term trends are in play. Cycling markets are ideal for swing trading however attempting to “trade the swing” in a trending market can be a recipe for disaster. Similarly, applying trend trading techniques during a cycling market can equally wreak havoc in your account. Cycle or trend modes can readily be identified in hindsight. But it would be useful to have an objective scientific approach to guide you as to the current market mode.
There are a number of tools already available to differentiate between cycle and trend modes. For example, measuring the trend slope over the cycle period to the amplitude of the cyclic swing is one possibility.
We begin by thinking of cycle mode in terms of frequency or its inverse, periodicity. Since the markets are fractal ; daily, weekly, and intraday charts are pretty much indistinguishable when time scales are removed. Thus it is useful to think of the cycle period in terms of its bar count. For example, a 20 bar cycle using daily data corresponds to a cycle period of approximately one month.
When viewed as a waveform, slow-varying price trends constitute the waveform's low frequency components and day-to-day fluctuations (noise) constitute the high frequency components. The objective in cycle mode is to filter out the unwanted components--both low frequency trends and the high frequency noise--and retain only the range of frequencies over the desired swing period. A filter for doing this is called a bandpass filter and the range of frequencies passed is the filter's bandwidth.
Indicator Features
-Zero lag or Regular Schaff Trend Cycle calculation
- Fixed or Band-pass Dominant Cycle for Schaff Trend Cycle MA period inputs
-10 different moving average options for Zero lag calculations
-Separate Band-pass Dominant Cycle calculations for both Schaff Trend Cycle and MA calculations
- Slow-to-Fast Band-pass Dominant Cycle input to tweak the ratio of Schaff Trend Cycle MA input periods as they relate to each other

TASC 2022.6 Ehlers' Loops - SectorsInspired by the latest TASC article, the crocker graph is expanded to show 5 tickers.
for commodity also draws a side box with current tickers candles so it can be used as standalone.

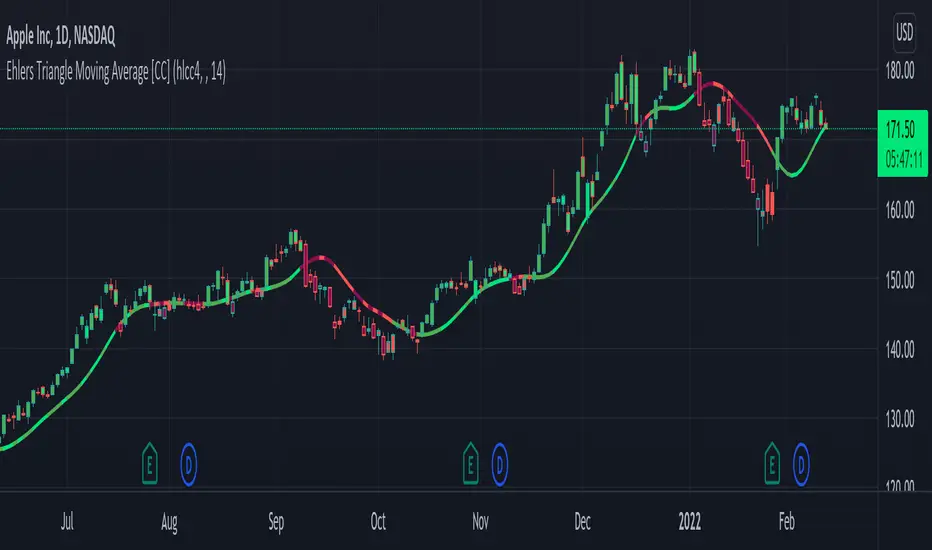
Ehlers Triangle Moving Average [CC]The Triangle Moving Average is the last of custom scripts converting Ehlers Window Indicators to Moving Averages. As you can see this is actually very similar to the Hamming Moving Average and the Hann Moving Average so I would recommend to test this one out with different settings and see what works best for you. As far as the formula calculation, it is a custom weighted moving average that determines how close the price is compared to the middle of the length period and gives a custom weight to that price. For example it will assign heavier weights according to how close the price is to the beginning of the loop (which is the most recent data) and lighter weights, the further the price is away from the recent prices. I have included strong buy and sell signals in addition to normal ones so strong signals are darker in color and normal signals are lighter in color. Buy when the line turns green and sell when it turns red.
Let me know if there are any other indicators or scripts you would like to see me publish!
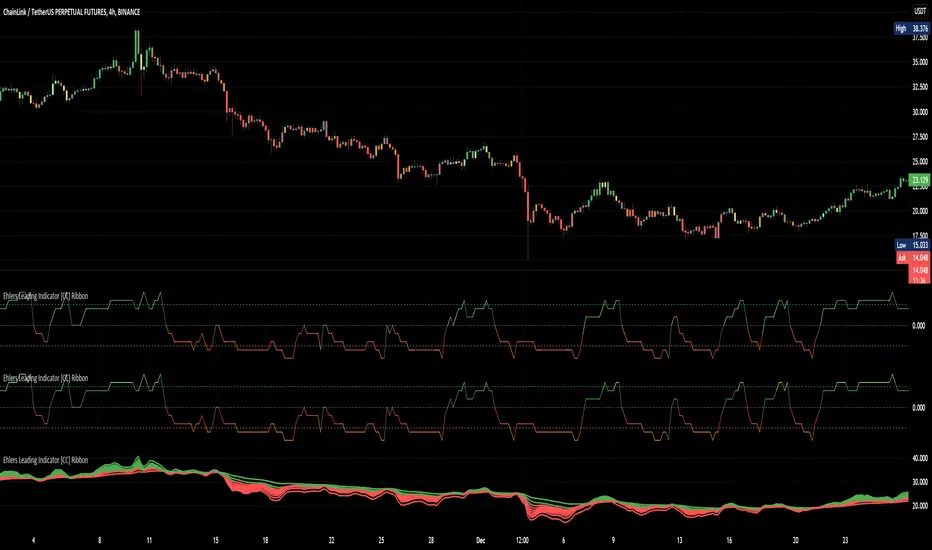
Ehlers Leading Indicator [CC] RibbonQuoted from Cheatcountry : “The Leading Indicator was created by John Ehlers (Cybernetic Analysis For Stocks And Futures pg 235) and as the name implies, this is a leading indicator that provides super early signals. Feel free to change the alpha values to adjust to your needs. Buy when the indicator line is green and sell when it is red.”
His original script:
This is a mod of Cheatcountrys script. I put it into a function and plotted several and implemented a tally of all.
Credit to him and John Ehler. Published with permission.
Ehlers Hamming Moving Average [CC]The Hamming Moving Average is a custom script I made to attempt to create a moving average using Ehler's Hamming Window Indicator . Let me stress that this is extremely experimental considering the original indicator works by creating a sine wave by adjusting the Pedestal value. Change the Pedestal value to anything 5 or higher and you will see what I mean. I think this is a fun experiment so let me know what you think. I have included strong buy and sell signals in addition to normal ones so strong signals are darker in color and normal signals are lighter in color. Buy when the line turns green and sell when it turns red.
Let me know if there are any other indicators or scripts you would like to see me publish!
