PROTECTED SOURCE SCRIPT
Arena-Hub-DC-Strategy V3.1
This script must be individually configured for each cryptocurrency. After monitoring several coins, I’ve realized that each one requires its own unique setup. There's no “one-size-fits-all” — and different timeframes require different configurations as well.
⚠️ Risk management is essential.
If you're not familiar with proper risk management, please do not use this script. Make sure to configure your commission and slippage settings appropriately, as these are critical for realistic backtesting results. The Stop Loss and Take Profit levels are not automated — they must be adjusted by the user.
This script is not a financial advisor. It won't make risk or profit-related decisions for you. It's a tool designed to help identify potential entries, trends, and exit opportunities — but all final decisions must be made by the trader.
The default settings are only examples. You’ll need to customize them for each crypto asset and timeframe to make the strategy truly work for your style and market conditions.
The script evaluates:
The positioning of two RSIs relative to each other
Their alignment with a customizable RSI-EMA
The values of EMAs and the ATR (volatility)
A custom weighting system using ADR and VOLUME, which strongly affects trade signals. The weights can be adjusted in 0.1 increments, and even small changes can have a big impact — so fine-tuning is important!
These indicators were chosen because they complement each other:
RSI and its EMA help identify momentum shifts
ATR gauges volatility to confirm market conditions
ADR and VOLUME help filter weak signals and fine-tune entries and exits
🔍 Important: Only use this script if you understand how RSI, EMA, ATR, ADR, and VOLUME indicators work, and are comfortable making your own trading decisions.
The backtest results are based on historical data — the script cannot see the future, not even guess it. Please use it responsibly.
This script is an advanced trend-following strategy that dynamically combines RSI, SMA, EMA, ATR, ADX, and volume indicators using a unique weighting and filtering mechanism. Instead of simply combining traditional indicators, it applies them in a unique way:
✅ Dual RSI Comparison: The strategy utilizes two RSI indicators, analyzing their relative movement to filter out false signals and provide more precise entry points.
✅ Custom Entry and Exit Rules: EMA crossovers alone do not generate signals; instead, they go through a dynamic RSI filter that takes market volatility into account using ATR and ADX.
✅ Intelligent Trend Identification: Instead of standard moving averages, a uniquely weighted SMA/EMA system is used to assess trend strength and stability.
✅ ATR, ADX & Volume-Based Weighting: The EMA length is dynamically adjusted based on ATR, ADX, and volume, allowing moving averages to react faster in strong trends while smoothing out in choppy markets.
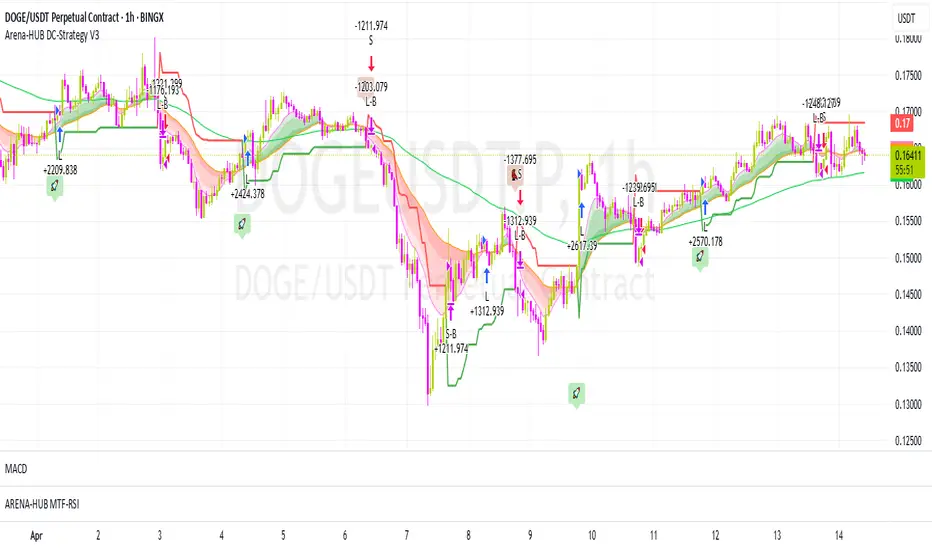
Advanced Dynamic EMA Zone
This is not your typical EMA indicator. It's an enhanced, dynamically adaptive trend zone that:
✅ Applies gradient shading – The zone between EMAs is divided into four layers, highlighting trend strength through smooth color transitions.
✅ Visualizes trend intensity – The strongest trends appear in the darkest shades, while weaker moves fade into lighter tones.
✅ Brings moving averages to life – Instead of static lines, it creates a visually intuitive trend channel.
✅ Differentiates bullish & bearish phases – The cloud fades from dark green to light green during an uptrend and from dark red to light red in a downtrend.
✅ Filters out market noise – Weakening trends appear more transparent, instantly revealing when momentum starts to fade.
✅ Enhances decision-making – Crossovers alone are not trading signals, but the visual representation helps identify market conditions at a glance.
➡️ What makes it unique?
Traditional moving average indicators rely on basic lines, but this is a full-fledged trend visualization system, helping traders filter noise and better understand price momentum.
🔄 Improved Custom EMA Smoothing Control
We’ve enhanced the weighting factor input for better user control! Previously, the EMA smoothing factor (ema1_smooth_factor) had a fixed step size that limited precision. Now, users can fine-tune it in 0.1 increments for greater flexibility.
✅ What’s new?
More precise control over EMA smoothing with adjustable step size (step=0.1).
Better adaptability to different market conditions.
Smoother trend visualization for traders who prefer fine-tuned settings.
This update ensures our custom EMA visualization remains superior to standard indicators. 🎯🔥
⚠️ Risk management is essential.
If you're not familiar with proper risk management, please do not use this script. Make sure to configure your commission and slippage settings appropriately, as these are critical for realistic backtesting results. The Stop Loss and Take Profit levels are not automated — they must be adjusted by the user.
This script is not a financial advisor. It won't make risk or profit-related decisions for you. It's a tool designed to help identify potential entries, trends, and exit opportunities — but all final decisions must be made by the trader.
The default settings are only examples. You’ll need to customize them for each crypto asset and timeframe to make the strategy truly work for your style and market conditions.
The script evaluates:
The positioning of two RSIs relative to each other
Their alignment with a customizable RSI-EMA
The values of EMAs and the ATR (volatility)
A custom weighting system using ADR and VOLUME, which strongly affects trade signals. The weights can be adjusted in 0.1 increments, and even small changes can have a big impact — so fine-tuning is important!
These indicators were chosen because they complement each other:
RSI and its EMA help identify momentum shifts
ATR gauges volatility to confirm market conditions
ADR and VOLUME help filter weak signals and fine-tune entries and exits
🔍 Important: Only use this script if you understand how RSI, EMA, ATR, ADR, and VOLUME indicators work, and are comfortable making your own trading decisions.
The backtest results are based on historical data — the script cannot see the future, not even guess it. Please use it responsibly.
This script is an advanced trend-following strategy that dynamically combines RSI, SMA, EMA, ATR, ADX, and volume indicators using a unique weighting and filtering mechanism. Instead of simply combining traditional indicators, it applies them in a unique way:
✅ Dual RSI Comparison: The strategy utilizes two RSI indicators, analyzing their relative movement to filter out false signals and provide more precise entry points.
✅ Custom Entry and Exit Rules: EMA crossovers alone do not generate signals; instead, they go through a dynamic RSI filter that takes market volatility into account using ATR and ADX.
✅ Intelligent Trend Identification: Instead of standard moving averages, a uniquely weighted SMA/EMA system is used to assess trend strength and stability.
✅ ATR, ADX & Volume-Based Weighting: The EMA length is dynamically adjusted based on ATR, ADX, and volume, allowing moving averages to react faster in strong trends while smoothing out in choppy markets.
Advanced Dynamic EMA Zone
This is not your typical EMA indicator. It's an enhanced, dynamically adaptive trend zone that:
✅ Applies gradient shading – The zone between EMAs is divided into four layers, highlighting trend strength through smooth color transitions.
✅ Visualizes trend intensity – The strongest trends appear in the darkest shades, while weaker moves fade into lighter tones.
✅ Brings moving averages to life – Instead of static lines, it creates a visually intuitive trend channel.
✅ Differentiates bullish & bearish phases – The cloud fades from dark green to light green during an uptrend and from dark red to light red in a downtrend.
✅ Filters out market noise – Weakening trends appear more transparent, instantly revealing when momentum starts to fade.
✅ Enhances decision-making – Crossovers alone are not trading signals, but the visual representation helps identify market conditions at a glance.
➡️ What makes it unique?
Traditional moving average indicators rely on basic lines, but this is a full-fledged trend visualization system, helping traders filter noise and better understand price momentum.
🔄 Improved Custom EMA Smoothing Control
We’ve enhanced the weighting factor input for better user control! Previously, the EMA smoothing factor (ema1_smooth_factor) had a fixed step size that limited precision. Now, users can fine-tune it in 0.1 increments for greater flexibility.
✅ What’s new?
More precise control over EMA smoothing with adjustable step size (step=0.1).
Better adaptability to different market conditions.
Smoother trend visualization for traders who prefer fine-tuned settings.
This update ensures our custom EMA visualization remains superior to standard indicators. 🎯🔥
Script protetto
Questo script è pubblicato come codice protetto. Tuttavia, è possibile utilizzarle liberamente e senza alcuna limitazione – ulteriori informazioni qui.
Magyar Discord Szerver -> Link Tagsághoz: whop.com/kriptoarenayt/
Declinazione di responsabilità
Le informazioni e le pubblicazioni non sono intese come, e non costituiscono, consulenza o raccomandazioni finanziarie, di investimento, di trading o di altro tipo fornite o approvate da TradingView. Per ulteriori informazioni, consultare i Termini di utilizzo.