OPEN-SOURCE SCRIPT
B's Average RSI (5m-1D)
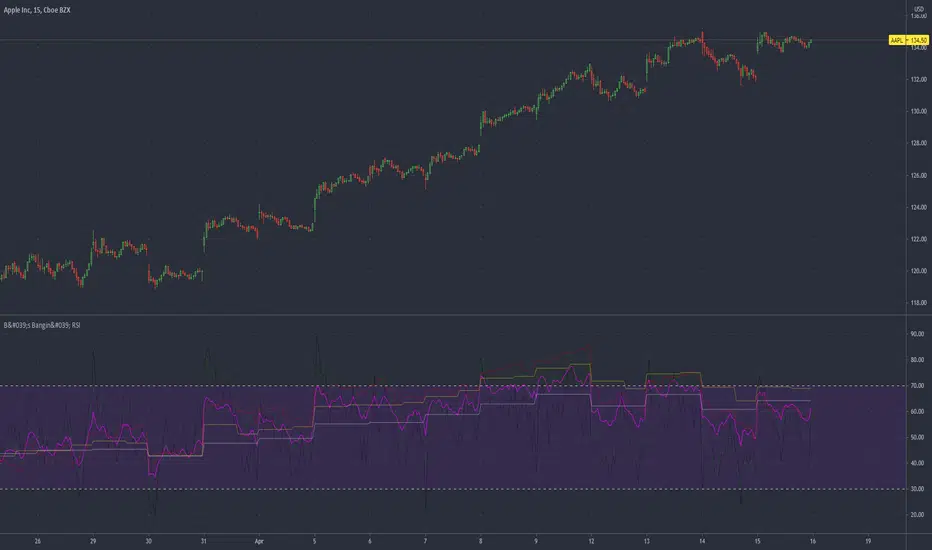
Multiple time frame RSIs plotted onto a single indicator.
Time frames used are:
5m (black)
15m (green)
60m (red)
240m (yellow)
Daily (white)
An average of all of the RSIs (pink)
RSI's are averaged into a single line. Also functions as multiple RSI's.
The pink average line should be used like any other RSI:
Above or below 50 signifies strength and weakness, respectively.
Above 80 and below 20 signal overbought and oversold conditions, respectively.
Script open-source
In pieno spirito TradingView, il creatore di questo script lo ha reso open-source, in modo che i trader possano esaminarlo e verificarne la funzionalità. Complimenti all'autore! Sebbene sia possibile utilizzarlo gratuitamente, ricorda che la ripubblicazione del codice è soggetta al nostro Regolamento.
Declinazione di responsabilità
Le informazioni ed i contenuti pubblicati non costituiscono in alcun modo una sollecitazione ad investire o ad operare nei mercati finanziari. Non sono inoltre fornite o supportate da TradingView. Maggiori dettagli nelle Condizioni d'uso.