OPEN-SOURCE SCRIPT
Aggiornato KINSKI RSI Short/Long

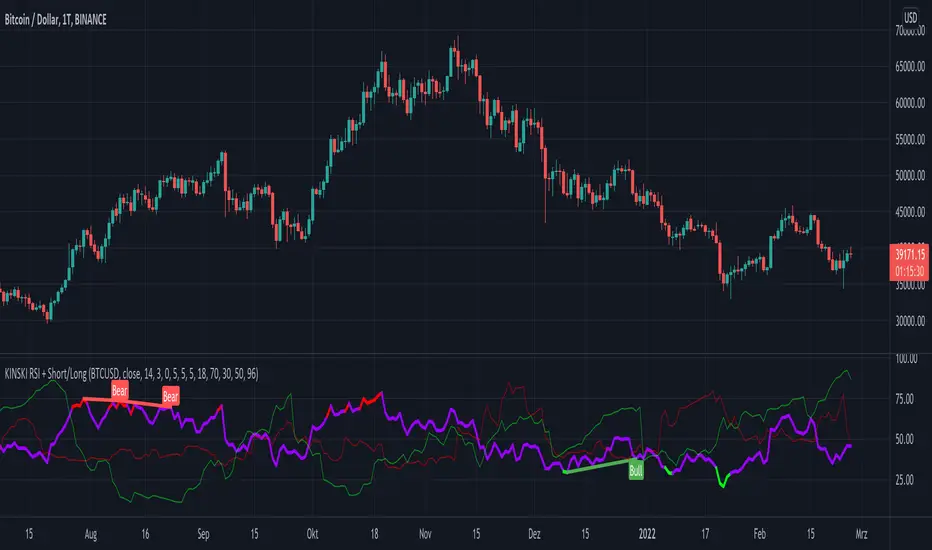
Extends the display of the Relative Strength Index (RSI) by shorts and longs from Bitmex and shows them as a diagram.
How to interpret the display?
- blue line is the default Relative Strength Index
- red line means "oversold
- green line "overbought"
- grey dotted line up/down indicates the optimal range for up and down movements 30 to 70
- in general, the reaching or crossing of the thresholds in the direction of the mid-range is seen as a possible buy or sell signal
- RSI values (blue line) of over 70 percent are considered "overbought", values below 30 percent "oversold
Which settings can be made?
- Selection for the "Currency". Default value is "BTCUSD". Currently only the following currencies are supported "BTCUSD", "ETHUSD", "ETCUSD", "OMGUSD", "XLMUSD", "XTZUSD".
- Selection for calculation formula ("Calculation"). The default value is "hlc3".
- Field for the moving average value ("RSI Length"). The default value is 14, but values of 7, 9 or 25 are also common. The shorter the period under consideration, the more volatile the indicator is, but with longer periods, fewer signals are triggered.
- furthermore you can make layout adjustments via the "Style" menu
Note di rilascio
- extend the supported currencies: "BTCUSD", "ETHUSD", "ETCUSD", "EOSUSD", "IOTUSD", "LTCUSD", "OMGUSD", "XRPUSD", "XMRUSD", "XLMUSD", "XTZUSD", "ZECUSD"
- changed the styling for Overbought and Oversold lines
Hint
the description text for red and green line is wrong. here now the correct description:
- red line indicates the number of SHORTS. Line up/down means many/less.
- green line indicates the number of LONGS. Line up/down means many/less.
Note di rilascio
- Display optimized for RSI line. Overbought zone (shows a possible sell-signal) is shown in red. Oversold zone (shows a possible buy signal) is displayed in green.
Note di rilascio
- removed no more needed Option "Up/Down Movements: On/Off"
Note di rilascio
- PineScript 4 compatibility increased. Deprecated attribute "transp" replaced by function color.new()Note di rilascio
- Convert to PineScript5
- add optional Divergence Identification (enabled by default)
Note di rilascio
- Code optimization: define type "color"
Script open-source
Nello spirito di TradingView, l'autore di questo script lo ha reso open source, in modo che i trader possano esaminarne e verificarne la funzionalità. Complimenti all'autore! Sebbene sia possibile utilizzarlo gratuitamente, ricordiamo che la ripubblicazione del codice è soggetta al nostro Regolamento.
My published Scripts:
de.tradingview.com/u/KINSKI/
Appreciation of my work: paypal.com/paypalme/steffenhollstein
de.tradingview.com/u/KINSKI/
Appreciation of my work: paypal.com/paypalme/steffenhollstein
Declinazione di responsabilità
Le informazioni e le pubblicazioni non sono intese come, e non costituiscono, consulenza o raccomandazioni finanziarie, di investimento, di trading o di altro tipo fornite o approvate da TradingView. Per ulteriori informazioni, consultare i Termini di utilizzo.