OPEN-SOURCE SCRIPT
Bloodbath Indicator

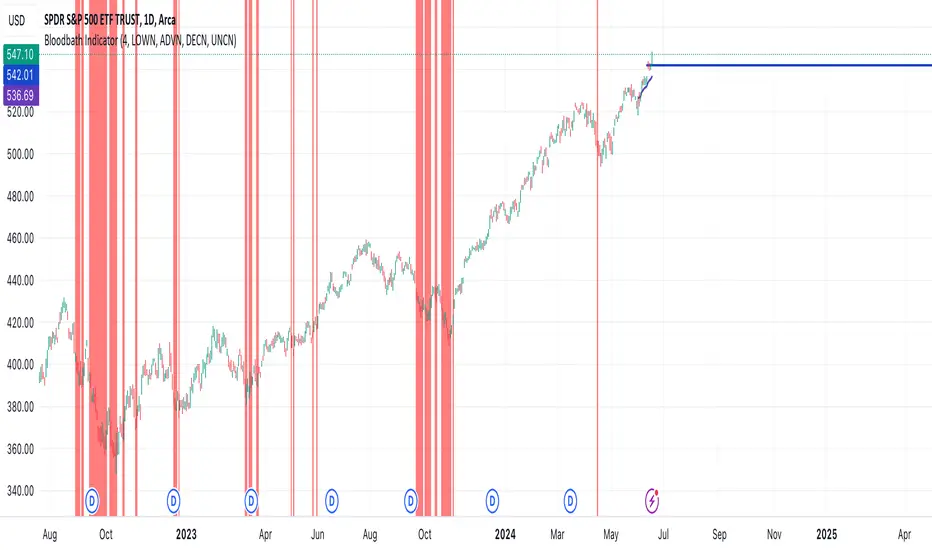
This indicator identifies days where the number of new 52-week lows for all issues exceeds a user-defined threshold (default 4%), potentially signaling a market downturn. The background of the chart turns red on such days, providing a visual alert to traders following the "Bloodbath Sidestepping" strategy.
Based on: "THE RIPPLE EFFECT OF DAILY NEW LOWS," By Ralph Vince and Larry Williams, 2024 Charles H. Dow Award Winner
threshold: Percentage of issues making new 52-week lows to trigger the indicator (default: 4.0).
Usage:
The chart background will turn red on days exceeding the threshold of new 52-week lows.
Limitations:
This indicator relies on historical data and doesn't guarantee future performance.
It focuses solely on new 52-week lows and may miss other market signals.
The strategy may generate false positives and requires further analysis before trading decisions.
Disclaimer:
This script is for informational purposes only and should not be considered financial advice. Always conduct your own research before making any trading decisions.
Script open-source
Nello spirito di TradingView, l'autore di questo script lo ha reso open source, in modo che i trader possano esaminarne e verificarne la funzionalità. Complimenti all'autore! Sebbene sia possibile utilizzarlo gratuitamente, ricordiamo che la ripubblicazione del codice è soggetta al nostro Regolamento.
Declinazione di responsabilità
Le informazioni e le pubblicazioni non sono intese come, e non costituiscono, consulenza o raccomandazioni finanziarie, di investimento, di trading o di altro tipo fornite o approvate da TradingView. Per ulteriori informazioni, consultare i Termini di utilizzo.