OPEN-SOURCE SCRIPT
VWAP - Trend

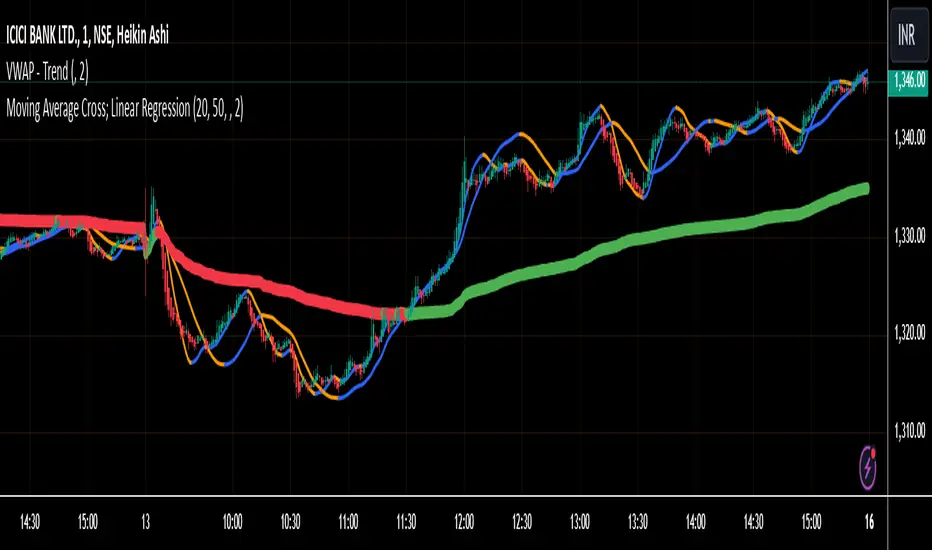
This Pine Script calculates the Volume Weighted Average Price (VWAP) for a specified timeframe and plots its Linear Regression over a user-defined lookback period. The regression line is color-coded: green indicates an uptrend and red indicates a downtrend. The line is broken at the end of each day to prevent it from extending into the next day, ensuring clarity on a daily basis.
Key Features:
VWAP Calculation: The VWAP is calculated based on a selected timeframe, providing a smoothed average price considering volume.
Linear Regression: The script calculates a linear regression of the VWAP over a custom lookback period to capture the underlying trend.
Color-Coding: The regression line is color-coded to easily identify trends—green for an uptrend and red for a downtrend.
Day-End Break: The regression line breaks at the end of each day to prevent continuous plotting across days, which helps keep the analysis focused within daily intervals.
User Inputs: The user can adjust the VWAP timeframe and the linear regression lookback period to tailor the indicator to their preferences.
This script provides a visual representation of the VWAP trend, helping traders identify potential market directions and turning points based on the linear regression of the VWAP.
Script open-source
Nello spirito di TradingView, l'autore di questo script lo ha reso open source, in modo che i trader possano esaminarne e verificarne la funzionalità. Complimenti all'autore! Sebbene sia possibile utilizzarlo gratuitamente, ricordiamo che la ripubblicazione del codice è soggetta al nostro Regolamento.
Declinazione di responsabilità
Le informazioni e le pubblicazioni non sono intese come, e non costituiscono, consulenza o raccomandazioni finanziarie, di investimento, di trading o di altro tipo fornite o approvate da TradingView. Per ulteriori informazioni, consultare i Termini di utilizzo.