OPEN-SOURCE SCRIPT
Aggiornato RSI-Colored Price Candles with Background
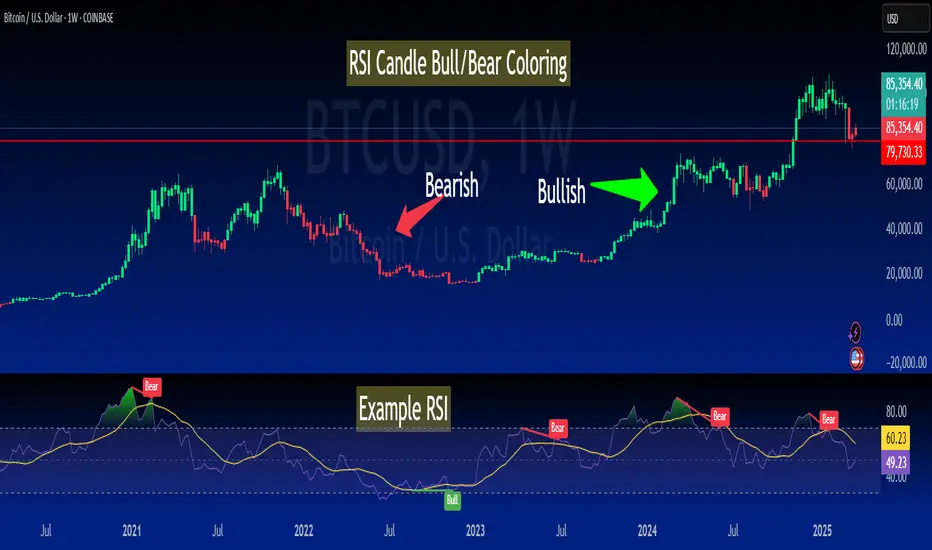
This Pine Script indicator visually enhances price candles based on **RSI (Relative Strength Index)** behavior, helping traders quickly assess momentum directly on the price chart.
**RSI Calculation:**
The RSI is computed using a traditional 14-period lookback. It uses `ta.rma()` to smooth average gains and losses, and then transforms the result into an RSI value between 0 and 100. This value is used to determine both **candle color** and optional **background shading**.
**Candle Coloring:**
Each price candle is recolored based on the current RSI value:
- If RSI is **greater than or equal to 50**, the candle is **bright green**, indicating bullish momentum.
- If RSI is **less than 50**, the candle is **bright red**, indicating bearish momentum.
The actual OHLC values of the candles remain unchanged. Only their color is modified to reflect RSI strength.
**Optional Background Highlighting:**
A user setting called `Show Overbought/Oversold Background` lets traders toggle background shading on or off. When enabled:
- If RSI is **above 70**, a soft **green** background appears, signaling overbought conditions.
- If RSI is **below 30**, a soft **red** background appears, signaling oversold conditions.
This provides an intuitive visual cue that highlights potential reversal or exhaustion zones based on RSI extremes.
**Custom Settings:**
- The RSI length and source are customizable.
- Background highlighting is turned **off by default**, giving users a clean chart unless they choose to enable it.
**Purpose and Use:**
This script is designed for traders who want to visually integrate RSI momentum directly into their chart candles, reducing the need to look away from price action. It's clean, responsive, and adjustable — perfect for intraday or swing traders who value simplicity backed by momentum data.
Note di rilascio
This Pine Script indicator visually enhances price candles based on **RSI (Relative Strength Index)** behavior, helping traders quickly assess momentum directly on the price chart.**RSI Calculation:**
The RSI is computed using a traditional 14-period lookback. It uses `ta.rma()` to smooth average gains and losses, and then transforms the result into an RSI value between 0 and 100. This value is used to determine both **candle color** and optional **background shading**.
**Candle Coloring:**
Each price candle is recolored based on the current RSI value:
- If RSI is **greater than or equal to 50**, the candle is **bright green**, indicating bullish momentum.
- If RSI is **less than 50**, the candle is **bright red**, indicating bearish momentum.
The actual OHLC values of the candles remain unchanged. Only their color is modified to reflect RSI strength.
**Optional Background Highlighting:**
A user setting called `Show Overbought/Oversold Background` lets traders toggle background shading on or off. When enabled:
- If RSI is **above 70**, a soft **green** background appears, signaling overbought conditions.
- If RSI is **below 30**, a soft **red** background appears, signaling oversold conditions.
This provides an intuitive visual cue that highlights potential reversal or exhaustion zones based on RSI extremes.
**Custom Settings:**
- The RSI length and source are customizable.
- Background highlighting is turned **off by default**, giving users a clean chart unless they choose to enable it.
**Purpose and Use:**
This script is designed for traders who want to visually integrate RSI momentum directly into their chart candles, reducing the need to look away from price action. It's clean, responsive, and adjustable — perfect for intraday or swing traders who value simplicity backed by momentum data.
Script open-source
Nello spirito di TradingView, l'autore di questo script lo ha reso open source, in modo che i trader possano esaminarne e verificarne la funzionalità. Complimenti all'autore! Sebbene sia possibile utilizzarlo gratuitamente, ricordiamo che la ripubblicazione del codice è soggetta al nostro Regolamento.
All opinions while deemed valid by its operators and shared on this board are not financial advice and are primarily for Entertainment Purposes.
Declinazione di responsabilità
Le informazioni e le pubblicazioni non sono intese come, e non costituiscono, consulenza o raccomandazioni finanziarie, di investimento, di trading o di altro tipo fornite o approvate da TradingView. Per ulteriori informazioni, consultare i Termini di utilizzo.