OPEN-SOURCE SCRIPT
Aggiornato Key Points of Adjoining Median (KPAM)
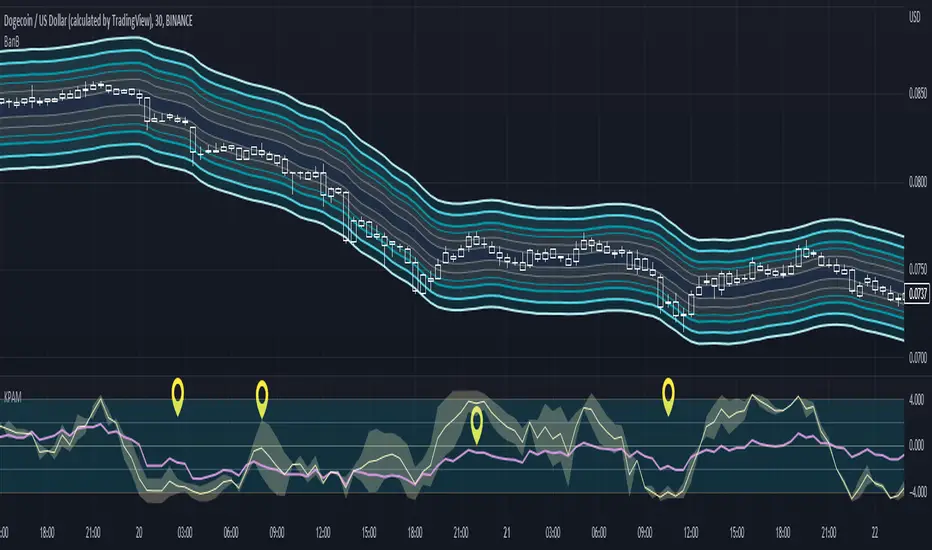
This indicator shows more reliable overbought & oversold levels buy combing 3 different level-indicators (i.e., indicators showing overbought/oversold levels).
A median is created by adjoining two of them and then it is assisted by a third one.
This reduces noise in calculating entries when using level indicators.
Note: The extra indicator shown is "Bands Bands (BanB)"
----- HOW TO USE IT -----
Use with price-action trading and with indicators showing the overall trend.
See notes in chart for more explanation.
The high and low levels of the RSI are within a range of 2 & -2 respectively.
The high and low levels for the median range from 4 & -4 respectively.
The Discordance shows how certain the level of the median is.
For example, if a part of the Discordance touches a low level while the median is at a higher level, then it usually indicates that the median is about to reverse.
The more Discordance that is visible, the less certain the current trend of the median is.
----- HOW THIS INDICATOR IS ORIGINAL; WHAT IT DOES AND HOW IT DOES IT -----
This indicator has an original, unique ability to reduce noise when comparing overbought and oversold levels.
It does this by first adjoining the Stochastic and the Stochastic RSI. Second, it creates a median from the two.
Third, the median is compared to the RSI on the same scale to assist in deciding where the median is at in relation to itself.
It shows whether the median lows and highs are near overbought or oversold levels.
----- VERSION -----
This is not a variant of the Stochastic, Stochastic RSI, and/or the RSI.
The focus is on the median that is created by an adjoining of the Stochastic and Stochastic RSI.
The Stochastic and Stochastic RSI are needed in order to obtain and plot the Median and the Discordance.
The RSI is plotted on the same scale to serve as the comparison needed to evaluate the Median levels with more visual accuracy.
Note di rilascio
Added additional customization options for more visual clarity.Note di rilascio
Added an EMA of the KPAM.Script open-source
Nello spirito di TradingView, l'autore di questo script lo ha reso open source, in modo che i trader possano esaminarne e verificarne la funzionalità. Complimenti all'autore! Sebbene sia possibile utilizzarlo gratuitamente, ricordiamo che la ripubblicazione del codice è soggetta al nostro Regolamento.
Declinazione di responsabilità
Le informazioni e le pubblicazioni non sono intese come, e non costituiscono, consulenza o raccomandazioni finanziarie, di investimento, di trading o di altro tipo fornite o approvate da TradingView. Per ulteriori informazioni, consultare i Termini di utilizzo.
Script open-source
Nello spirito di TradingView, l'autore di questo script lo ha reso open source, in modo che i trader possano esaminarne e verificarne la funzionalità. Complimenti all'autore! Sebbene sia possibile utilizzarlo gratuitamente, ricordiamo che la ripubblicazione del codice è soggetta al nostro Regolamento.
Declinazione di responsabilità
Le informazioni e le pubblicazioni non sono intese come, e non costituiscono, consulenza o raccomandazioni finanziarie, di investimento, di trading o di altro tipo fornite o approvate da TradingView. Per ulteriori informazioni, consultare i Termini di utilizzo.