Icy-Hot Visual Indicator [SciQua]
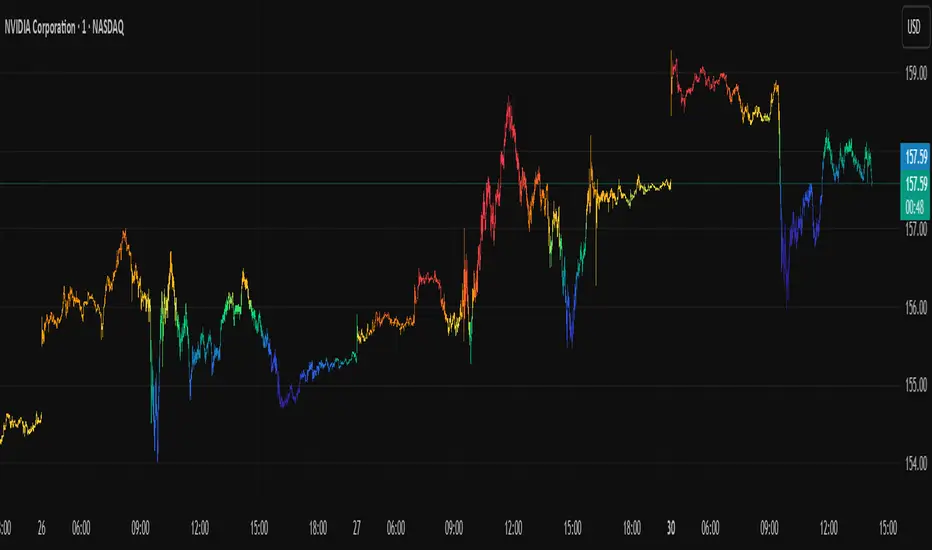
This indicator colors your price bars and/or chart background based on a normalized & smoothed transform of any price-based input (default: close). It gives you a quick “temperature map” of market momentum or volatility—cool blues for low readings, hot reds for high readings—without cluttering your chart.
🔍 Key Features
1. Dual Visual Layers
- Candle Gradient: Applies a smooth, multi-color gradient to candle bodies and wicks based on normalized, smoothed input data
- Background Gradient: Adds a semi-transparent gradient behind the candles to highlight broader trend zones or volatility regimes
2. Advanced Customization
- Normalization Types: bounded, unbounded, z-score, MAD, percentile, sigmoid, tanh, rank, robust, and more
- Smoothing Methods: EMA, SMA, WMA, RMA, HMA, TEMA, VWMA, Gaussian, LinReg, ExpReg, and others (12+ options)
3. Gradient Control: Choose 2–7 color stops, reverse direction, adjust display length
- Flexible Source Inputs
- Use any built-in price series (close, hl2, volume, etc.)
- Feed outputs from external indicators (RSI, custom oscillators, moving averages) into either layer
❓How It Works
Inputs are normalized (z-score, bounded, etc.) then smoothed (EMA, LinReg, etc.) in the order you choose. The result is clamped to 0–1 and passed through a multi-stop gradient engine for precise color mapping.
✨ What Makes It Original
While many indicators apply colors or smoothing, this script combines multi-stage normalization, adaptive smoothing, and a modular gradient rendering engine in a highly customizable dual-layer system. It’s built using proprietary functions from the SciQua suite that are not available in public libraries and allow for advanced visual encoding without relying on alerts, signals, or extra panes.
This makes it original in both design and execution—offering a visual-first approach with unique depth, clarity, and flexibility.
🔐 Why This Script Is Closed-Source
While the underlying functions are published in the open-source SciQua library, this indicator’s specific implementation, configuration architecture, and visual behavior are proprietary. It combines multiple library utilities into a dual-layer adaptive system that handles advanced gradient rendering, multi-stage normalization, and smoothing pipelines in a unique way.
The source is closed to protect the design logic, interface abstraction, and fine-tuned behaviors that make this indicator commercially valuable. The building blocks are open to the Pine community, but this assembled product is not meant for replication or redistribution.
How to Use It
1. Highlight Trend Strength
- Source: RSI percentile
- Setup: 200-bar look-back, mild smoothing
- Result: Warm tones when momentum is peaking; cool when it’s fading. Use as a quick filter for entries in the direction of the trend.
2. Visualize Volatility Regimes
- Source: ATR or True Range
- Setup: Bounded normalization with tighter smoothing bar color off, bg color on.
- Result: Background bands that shade when volatility spikes. Helps you avoid low-volatility breakouts or throttle position sizing in choppy markets.
3. Combine with Other Indicators
- Source: Output of your custom indicator (e.g., a Keltner Band width)
- Setup: Match normalization period to your strategy’s timeframe
- Result: Bars colored by your own logic—no extra panes, just enhanced candles.
4. Background Only Heatmap
- Turn off bar coloring and dial in semi-transparent background shades—keeps candles crisp while still giving you a context heat-map behind price.
Script su invito
Solo gli utenti approvati dall'autore possono accedere a questo script. È necessario richiedere e ottenere l'autorizzazione per utilizzarlo. Tale autorizzazione viene solitamente concessa dopo il pagamento. Per ulteriori dettagli, seguire le istruzioni dell'autore riportate di seguito o contattare direttamente JoshuaDanford.
TradingView NON consiglia di acquistare o utilizzare uno script a meno che non si abbia piena fiducia nel suo autore e se ne comprenda il funzionamento. È inoltre possibile trovare alternative gratuite e open source nei nostri script della community.
Istruzioni dell'autore
TradingView indicators, backtesting tools, weekly contests, and live market analysis.
Join free, compete, win, and stay updated at sciqua.com
Declinazione di responsabilità
Script su invito
Solo gli utenti approvati dall'autore possono accedere a questo script. È necessario richiedere e ottenere l'autorizzazione per utilizzarlo. Tale autorizzazione viene solitamente concessa dopo il pagamento. Per ulteriori dettagli, seguire le istruzioni dell'autore riportate di seguito o contattare direttamente JoshuaDanford.
TradingView NON consiglia di acquistare o utilizzare uno script a meno che non si abbia piena fiducia nel suo autore e se ne comprenda il funzionamento. È inoltre possibile trovare alternative gratuite e open source nei nostri script della community.
Istruzioni dell'autore
TradingView indicators, backtesting tools, weekly contests, and live market analysis.
Join free, compete, win, and stay updated at sciqua.com