OPEN-SOURCE SCRIPT
Aggiornato Pinks MultiRSI
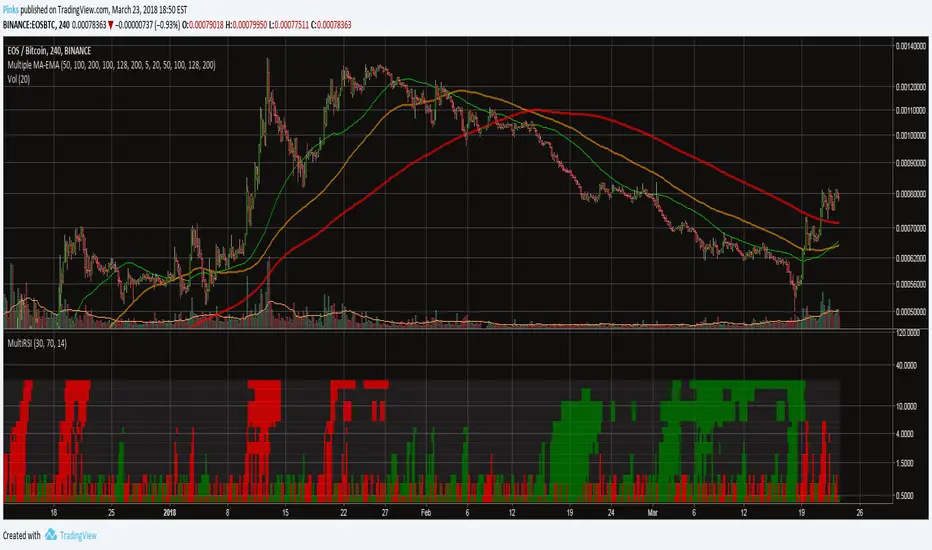
An indicator that displays whether RSI is oversold, undersold, or neutral, on several timeframes:
15m, 30m, 45m, 1h, 2h, 3h, 4h, 5h, 6h, 12h, 18h, 1D.
If RSI for a specific interval is overbought, the bars for that interval turn red (for "sell"). If it is oversold, it turns green (for "buy"). The RSI length, oversold level, and overbought level are tuneable.
The bottom row of coloumns is 15m RSI, top row is 1D RSI. It is recommended to use log scale on this indicator. The bar height is proportional to the interval it cover.
Note di rilascio
**NEW FEATURES**/b]You can now set multiple levels of overbought and oversold! The columns will be colored according to how oversold or overbought the RSI is. This will help you get a clearer image of the RSI on all timeframes.
Note di rilascio
Fixed bug where 5h RSI was set to 4h.Note di rilascio
Changed chart imageScript open-source
Nello spirito di TradingView, l'autore di questo script lo ha reso open source, in modo che i trader possano esaminarne e verificarne la funzionalità. Complimenti all'autore! Sebbene sia possibile utilizzarlo gratuitamente, ricordiamo che la ripubblicazione del codice è soggetta al nostro Regolamento.
Declinazione di responsabilità
Le informazioni e le pubblicazioni non sono intese come, e non costituiscono, consulenza o raccomandazioni finanziarie, di investimento, di trading o di altro tipo fornite o approvate da TradingView. Per ulteriori informazioni, consultare i Termini di utilizzo.
Script open-source
Nello spirito di TradingView, l'autore di questo script lo ha reso open source, in modo che i trader possano esaminarne e verificarne la funzionalità. Complimenti all'autore! Sebbene sia possibile utilizzarlo gratuitamente, ricordiamo che la ripubblicazione del codice è soggetta al nostro Regolamento.
Declinazione di responsabilità
Le informazioni e le pubblicazioni non sono intese come, e non costituiscono, consulenza o raccomandazioni finanziarie, di investimento, di trading o di altro tipo fornite o approvate da TradingView. Per ulteriori informazioni, consultare i Termini di utilizzo.