OPEN-SOURCE SCRIPT
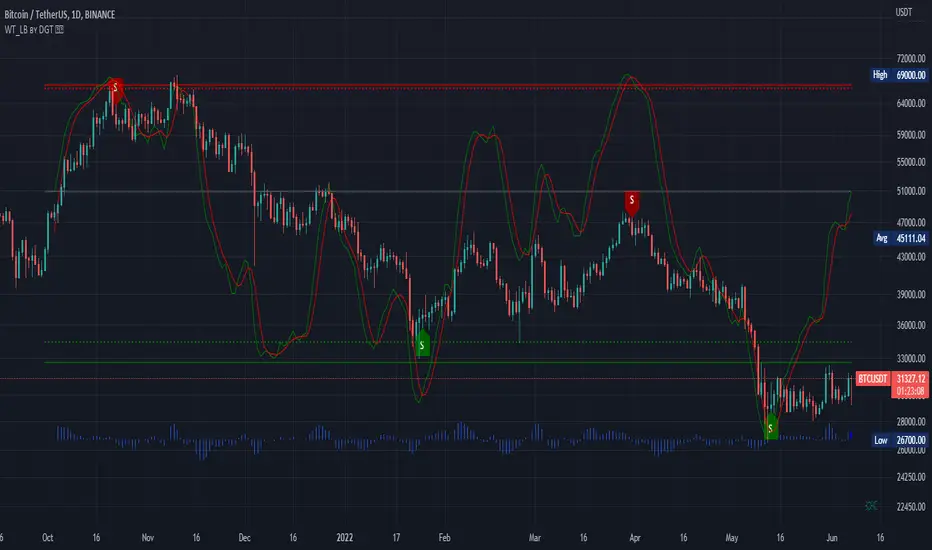
Aggiornato WaveTrend [LazyBear] vX by DGT

DGT interpreted version of LazyBear's WaveTrend, visualizing on Price Chart
Original Author : LazyBear
Crosses above or below threshold are emphasized with bigger labels
- crosses above threshold : probable short indications with a bigger label and relativly small label for probable long indications
- crosses below threshold : probable long indications with a bigger label and relativly small label for probable short indications
All rest crosses within threshold boundaries with relatively small labels for both long and short probable indications
Note di rilascio
small update : alert condition addedNote di rilascio
update thanks to sandyrindal suggestions, special thanks to himadded ability to change the signal length
added ability to compare with other symbols, can be symbols that are directly correlated or inversely correlated symbols
Here is the modified code for the ones who enjoy the WaveTrend Oscillator on separate pane
//@version=4
//@author LazyBear, modified by dgtrd
study(title="WaveTrend [LazyBear]", shorttitle="WT_LB vX ʙʏ DGT ☼☾")
n1 = input(10, "Length : Channel ", inline = "LEN")
n2 = input(21, "Average", inline = "LEN")
s1 = input(4 , "Signal Length")
obLevel1 = input( 60, "Over Bought Level 1", inline = "OB")
obLevel2 = input( 53, "Level 2" , inline = "OB")
osLevel1 = input(-60, "Over Sold Level 1" , inline = "OS")
osLevel2 = input(-53, "Level 2" , inline = "OS")
f_getWT(s) =>
ap = s
esa = ema(ap, n1)
d = ema(abs(ap - esa), n1)
ci = (ap - esa) / (0.015 * d)
tci = ema(ci, n2)
wt1 = tci
wt2 = sma(wt1, s1)
[wt1, wt2]
plot(0 , color=color.gray )
plot(obLevel1, color=color.red )
plot(osLevel1, color=color.green)
plot(obLevel2, color=color.red , style=3)
plot(osLevel2, color=color.green, style=3)
[wt1, wt2] = f_getWT(hlc3)
plot(wt1 , color=color.green)
plot(wt2 , color=color.red , style=3)
plot(wt1-wt2, color=color.blue , style=plot.style_area, transp=80)
compare = input(false, "Compare with Symbol", inline = "CPR")
symbol = input("CBOE:VIX" , "", type=input.symbol, inline = "CPR")
extSrc = security (symbol , timeframe.period, hlc3, barmerge.gaps_off, barmerge.lookahead_on)
[wt1x, wt2x] = f_getWT(extSrc)
plot(compare ? wt1x : na, color=color.aqua)
plot(compare ? wt2x : na, color=color.yellow, style=3)
plot(compare ? wt1x-wt2x : na, color=color.olive, style=plot.style_area, transp=80)
Note di rilascio
added a label to display current values of the wavetrend and signal level Note di rilascio
Update* overlay wavetrand display addition, better interpretation
* enhanced signal customizations
Similar Indicators
Oscillators Overlay w/ Divergencies/Alerts : Oscillators-Overlay-with-Divergencies-Alerts
Elliott Wave Oscillator Signals : EWO-Signals
Script open-source
Nello spirito di TradingView, l'autore di questo script lo ha reso open source, in modo che i trader possano esaminarne e verificarne la funzionalità. Complimenti all'autore! Sebbene sia possibile utilizzarlo gratuitamente, ricordiamo che la ripubblicazione del codice è soggetta al nostro Regolamento.
Premium Indicators – Try Free for 15 Days: sites.google.com/view/solemare-analytics
Declinazione di responsabilità
Le informazioni e le pubblicazioni non sono intese come, e non costituiscono, consulenza o raccomandazioni finanziarie, di investimento, di trading o di altro tipo fornite o approvate da TradingView. Per ulteriori informazioni, consultare i Termini di utilizzo.