OPEN-SOURCE SCRIPT
Tide Tracker Zones
Tide Tracker Zones – Advanced Trend & Pullback Visualizer
Overview
Tide Tracker Zones is a sophisticated trading tool designed for traders who require clarity, precision, and actionable insights in real time. The indicator converts price action into dynamic trend zones, allowing users to instantly recognize market direction, potential reversals, and low-risk entry opportunities. By visualizing the market in this way, traders can focus on execution rather than deciphering complex charts.
Unlike static indicators, Tide Tracker Zones adapts to market volatility, providing a clear picture of bullish and bearish pressure across multiple timeframes. Its visual design, including color-coded trend zones, a prominent guide line, and carefully placed signals, ensures that market behavior is easy to interpret, making it suitable for scalping, swing trading, and longer-term strategies alike.

How It Works
The indicator relies on dynamic upper and lower bands derived from recent price ranges and a configurable multiplier. These bands expand during volatile periods and contract when price action stabilizes, creating flexible zones that reflect the dominant market tide.
A guide line tracks the active band, serving as a continuous reference for trend direction. Unlike traditional moving averages, the guide line does not clutter the chart but instead provides a subtle, intuitive indication of whether the market is in a bullish or bearish phase. Background shading reinforces this trend visually, highlighting bullish zones in one color and bearish zones in another, so the prevailing market flow is immediately clear.
The system continuously evaluates price relative to the bands to determine trend direction and detect potential reversals. When price crosses a band and flips the trend, the guide line updates, and signals are generated, providing traders with actionable information without overwhelming the chart.
Signals and Pullbacks
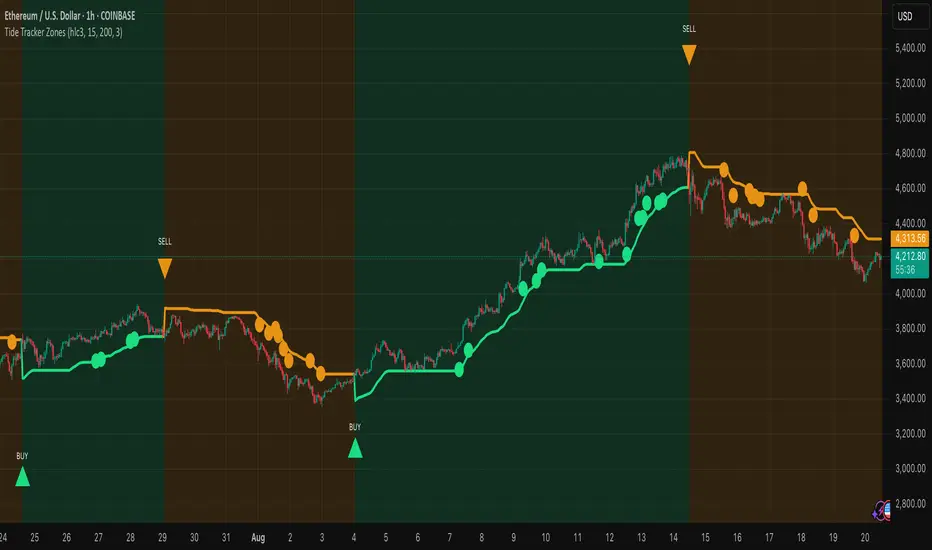
Tide Tracker Zones offers visual cues that make entry points more obvious and less speculative. Trend reversal arrows are plotted when the market changes direction: BUY arrows indicate a shift from bearish to bullish, and SELL arrows indicate a shift from bullish to bearish.
The indicator also highlights first pullbacks within an active trend. These pullback dots mark low-risk opportunities to enter a trend in progress, filtered to ensure that only the most relevant signals are displayed. The system uses ATR-based spacing to place arrows and dots vertically on the chart, preventing visual clutter and ensuring readability even during periods of high volatility.
Color-coded zones enhance situational awareness. Bullish zones are displayed in a customizable orange, while bearish zones are shown in green. Transparency is dynamically adjusted to maintain chart clarity while still providing a clear indication of trend strength.
Strategy Integration
Tide Tracker Zones can be used effectively for both trend-following and pullback strategies. Traders may enter positions in the direction of the guide line and colored zone, using trend reversal arrows for confirmation. First pullback dots offer tactical entries with reduced risk, allowing traders to enter a trend after a brief retracement.
Stop-loss levels can be placed just beyond the opposing trend zone, while take-profit targets may be determined using the width of the bands to account for market volatility. The indicator adapts seamlessly across multiple timeframes. Higher timeframes provide context and filter noise, while lower timeframes allow traders to refine entry timing. This makes it a versatile tool for scalping, swing trading, or longer-term positions.
Advanced Techniques
For traders seeking greater precision, Tide Tracker Zones can be combined with volume or momentum indicators to validate signals. Observing the sequence of trend arrows and pullback dots allows users to develop a systematic approach to entries and exits. Monitoring the width and behavior of the bands over time can also provide insights into periods of expanding or contracting volatility, helping traders anticipate market shifts.
Adjustments to the spread length and multiplier allow the indicator to be tuned for different assets and market conditions. By understanding the interaction between the guide line, trend zones, and pullback signals, traders can create a robust framework for decision-making, reducing guesswork and improving consistency.
Why Use Tide Tracker Zones
Tide Tracker Zones provides instant clarity and actionable insight in any market. Its dynamic zones and guide line give a clear visual understanding of trend direction, while trend reversal arrows and pullback dots highlight potential entry points. Unlike traditional indicators, it adapts to volatility and changing conditions, making it reliable across multiple asset classes and timeframes.
By combining trend detection, pullback analysis, and intuitive visual guidance, Tide Tracker Zones equips traders with a complete framework for disciplined, confident trading, transforming complex price action into a visual map of opportunity.
Overview
Tide Tracker Zones is a sophisticated trading tool designed for traders who require clarity, precision, and actionable insights in real time. The indicator converts price action into dynamic trend zones, allowing users to instantly recognize market direction, potential reversals, and low-risk entry opportunities. By visualizing the market in this way, traders can focus on execution rather than deciphering complex charts.
Unlike static indicators, Tide Tracker Zones adapts to market volatility, providing a clear picture of bullish and bearish pressure across multiple timeframes. Its visual design, including color-coded trend zones, a prominent guide line, and carefully placed signals, ensures that market behavior is easy to interpret, making it suitable for scalping, swing trading, and longer-term strategies alike.
How It Works
The indicator relies on dynamic upper and lower bands derived from recent price ranges and a configurable multiplier. These bands expand during volatile periods and contract when price action stabilizes, creating flexible zones that reflect the dominant market tide.
A guide line tracks the active band, serving as a continuous reference for trend direction. Unlike traditional moving averages, the guide line does not clutter the chart but instead provides a subtle, intuitive indication of whether the market is in a bullish or bearish phase. Background shading reinforces this trend visually, highlighting bullish zones in one color and bearish zones in another, so the prevailing market flow is immediately clear.
The system continuously evaluates price relative to the bands to determine trend direction and detect potential reversals. When price crosses a band and flips the trend, the guide line updates, and signals are generated, providing traders with actionable information without overwhelming the chart.
Signals and Pullbacks
Tide Tracker Zones offers visual cues that make entry points more obvious and less speculative. Trend reversal arrows are plotted when the market changes direction: BUY arrows indicate a shift from bearish to bullish, and SELL arrows indicate a shift from bullish to bearish.
The indicator also highlights first pullbacks within an active trend. These pullback dots mark low-risk opportunities to enter a trend in progress, filtered to ensure that only the most relevant signals are displayed. The system uses ATR-based spacing to place arrows and dots vertically on the chart, preventing visual clutter and ensuring readability even during periods of high volatility.
Color-coded zones enhance situational awareness. Bullish zones are displayed in a customizable orange, while bearish zones are shown in green. Transparency is dynamically adjusted to maintain chart clarity while still providing a clear indication of trend strength.
Strategy Integration
Tide Tracker Zones can be used effectively for both trend-following and pullback strategies. Traders may enter positions in the direction of the guide line and colored zone, using trend reversal arrows for confirmation. First pullback dots offer tactical entries with reduced risk, allowing traders to enter a trend after a brief retracement.
Stop-loss levels can be placed just beyond the opposing trend zone, while take-profit targets may be determined using the width of the bands to account for market volatility. The indicator adapts seamlessly across multiple timeframes. Higher timeframes provide context and filter noise, while lower timeframes allow traders to refine entry timing. This makes it a versatile tool for scalping, swing trading, or longer-term positions.
Advanced Techniques
For traders seeking greater precision, Tide Tracker Zones can be combined with volume or momentum indicators to validate signals. Observing the sequence of trend arrows and pullback dots allows users to develop a systematic approach to entries and exits. Monitoring the width and behavior of the bands over time can also provide insights into periods of expanding or contracting volatility, helping traders anticipate market shifts.
Adjustments to the spread length and multiplier allow the indicator to be tuned for different assets and market conditions. By understanding the interaction between the guide line, trend zones, and pullback signals, traders can create a robust framework for decision-making, reducing guesswork and improving consistency.
Why Use Tide Tracker Zones
Tide Tracker Zones provides instant clarity and actionable insight in any market. Its dynamic zones and guide line give a clear visual understanding of trend direction, while trend reversal arrows and pullback dots highlight potential entry points. Unlike traditional indicators, it adapts to volatility and changing conditions, making it reliable across multiple asset classes and timeframes.
By combining trend detection, pullback analysis, and intuitive visual guidance, Tide Tracker Zones equips traders with a complete framework for disciplined, confident trading, transforming complex price action into a visual map of opportunity.
Script open-source
Nello spirito di TradingView, l'autore di questo script lo ha reso open source, in modo che i trader possano esaminarne e verificarne la funzionalità. Complimenti all'autore! Sebbene sia possibile utilizzarlo gratuitamente, ricordiamo che la ripubblicazione del codice è soggetta al nostro Regolamento.
Declinazione di responsabilità
Le informazioni e le pubblicazioni non sono intese come, e non costituiscono, consulenza o raccomandazioni finanziarie, di investimento, di trading o di altro tipo fornite o approvate da TradingView. Per ulteriori informazioni, consultare i Termini di utilizzo.