Gorb DNA
Gorb DNA is a versatile indicator using classic technical analysis components such as moving averages, stochastic oscillator, and histogram blending call/put flow analysis with our proprietary DNA algorithm. This indicator is designed to provide traders with useful market direction, volume, and momentum change visual cues.
Overview:
- The Gorb DNA Indicator isn't just another momentum tool; it's a complex integration of innovative market analysis techniques.
- By combining moving averages, stochastic oscillator, with proprietary algorithms, this indicator offers a multi-layered view of market trends, by merging call/put flow analysis with traditional market flow assessment.
- This is designed for all kinds of traders, using a simple method to deliver visual changes in flow, volume, and momentum.
Core Features: Call/Put Flow & DNA
- Call/Put Flow Analysis: This component examines the strength of market buying and selling pressures. It analyzes call (buying) and put (selling) flows using price range movements, providing insights smoothed over a defined period for analysis of market sentiment.
- DNA Algorithm: A central feature of this indicator, the DNA algorithm utilizes a specialized moving average and oscillator technique to discern market trends. It presents an innovative approach, calculating the difference between bullish and bearish indicators to offer a detailed analysis of market momentum.
- Visualization and Color Coding: The indicator employs a color-coded system for ease of interpretation, with distinct colors indicating different market conditions: white for upward/bullish movement and purple for downward/bearish movement. This feature translating complex data into a visual format that is simple to understand.
How Call/Put Flow Works:
- Moving averages are used with volume and candlestick highs/lows over a specific range to help determine the overall flow. It then plots a colored line area that looks like a colored wave using just two colors to provide traders with a visual of the current market flow. This can help traders identify changes in sentiment with simple color cues.
How DNA Works:
- A stochastic oscillator is used to measure the current price level relative to its price over a specific range period to analyze the momentum for the two DNA strands. Additionally moving averages are used to confirm trend and identify any divergences relative to the momentum. This is then plotted as two lines(DNA Strands) following the same color scheme as Call/Put Flow. When momentum is picking up in a specific direction, the lines will change colors and cross each other, this gives a visual of momentum now being fully on one side until it starts to change colors and flip that direction.
Custom Algorithm Elements:
- Gorb DNA isn't just common tools combined into one indicator. It includes proprietary algorithmic elements tailored to enhance technical analysis and timing. These are the reasons what set this indicator apart from common momentum, sentiment, and volume methods.
We recommend experimenting with these features to choose what best suits your trading style.
Settings:
- All skill-level friendly presets, easy to enable features with one-click
- Call Flow: allows the user to plot a colored area that looks like waves showing increases/decreases in bullish volume (not to be followed blindly)
- Put Flow: allows the user to plot a colored area that looks like waves showing increases/decreases in bearish volume (not to be followed blindly)
- DNA Strand 1: allows the user to plot one of the algorithm lines to visualize momentum direction (not to be followed blindly)
- DNA Strand 2: allows the user to plot one of the algorithm lines to visualize momentum direction (not to be followed blindly)
- DNA Strength: allows the user to a histogram displaying momentum volume bars in the background
- Flow Threshold: allows users to plot a dotted line to identify when call/put flow is now above average flow range
- All colors are changeable for the user to customize to their liking
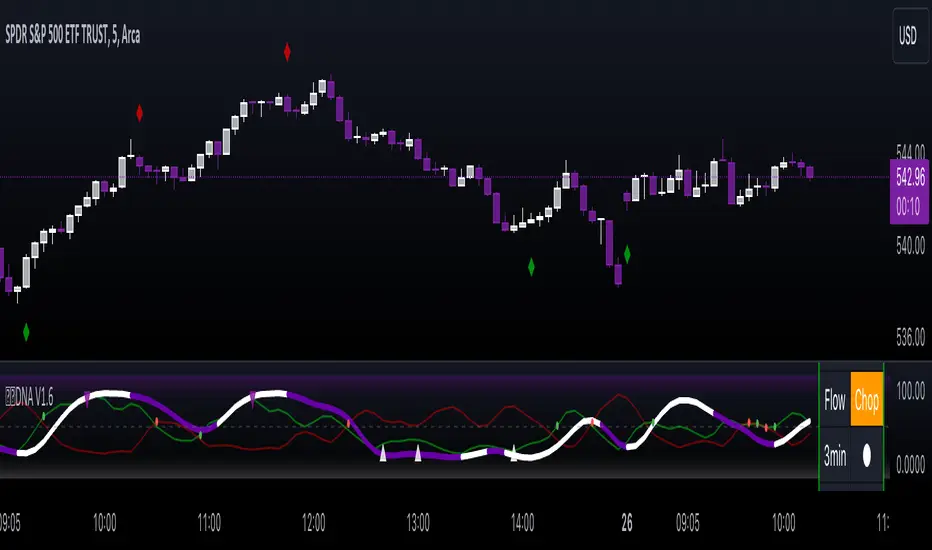
Call/Put Flow & DNA Demonstration
In the image below, we can see a basic illustration of how these core features function.
As stated above, call/put flow carefully monitors changes in moving averages, volume, and price action. If the market sentiment is shifting one direction, the call/put flow will plot those changes. If market is bullish, call flow should rise and put flow should decrease. The same goes for the opposite if the market is bearish.
As is the same for the DNA strands, if markets momentum is becoming bullish, the lines will change color and then cross to signify a change in momentum and the call flow in the background should match this change. This creates two layers of confluence in an easy understandable visual method.
Using Call/Put Flow
In the image below, we disabled everything but call flow to demonstrate usage.
On the left side of the image, you can see call flow matched price increase, then started to decline. This created a flow divergence, identifying a possible change in price action coming. This happened once flow crossed back below the threshold line and price then beginning to move lower. On the right side of the image, you can see call flow rising and price increasing. This is a good confluence showing there is bullish sentiment building in the market.
In this next image, we disabled everything but put flow to demonstrate usage.
The left side shows a put flow divergence. Put flow is slowly rising just like price is, this can help a trader identify a possible shift in sentiment coming. And on the right side, we have put flow rising above the threshold line and price beginning to decrease. Now we have confluence of bearish sentiment building in the market.
The image below shows only call & put flow enabled, to display what the above two images combined look like.
As you can see in the image above, these flow visuals help identify the underlying market sentiment. And when they cross, it leads to a change in price action in the direction of the sentiment over the threshold line.
Using DNA Strands
The image below has just DNA strands enabled to demonstrate usage.
On the left is a box highlighting bearish momentum cross. In the circles is the change in momentum shifting from bullish to bearish. The move gets stronger as the DNA strands get closer to cross over signifying strength in the move. On the right side is a box highlighting a bullish momentum cross. The circles again, show the change from bearish to bullish momentum. Like previously said, the move gets stronger as the DNA strands get closer to crossing over, signifying strength in that direction.
The next image shows call/put flow and DNA strands enabled for a full complete picture.
The circles labeled (1) are showing the change in momentum from bullish to bearish. Circle (2) shows call flow decreasing and put flow rising above calls. Finally the arrow points to the DNA strands crossing over and put flow rising above the threshold line. This is 3 levels of easy visual confluence showing a change in sentiment, volume, and momentum to the downside.
The next image will be showing the bullish side with call/put flow and DNA strands enabled.
The circles that are labeled (1), show the visual change in momentum on the DNA strands from bearish to bullish. Circle (2) is the crossing of call flow over put flow and the arrow points to the DNA strands crossing over and call flow above the threshold line. Three simple to use visual confluences to identify change in sentiment, volume, and momentum to the upside.
Conclusion:
Our goal is to provide a unique, yet simple approach to market sentiment & momentum analysis. It's a tool developed for traders seeking user-friendly and easy to use tools that provide easy visual insights of market dynamics. We believe in simplicity, effectiveness, and creating tools to support decision making for all traders.
How to get access:
You can see the Author's instructions to get access to this indicator
RISK DISCLAIMER
All content, tools, scripts & education provided by Gorb Algo are for informational & educational purposes only. Trading is risky and most lose their money, past performance does not guarantee future results.
- Added version version number in the short-title
- Added user inputs to easily toggle on/off call & put flow, DNA Strands, and DNA Strength
- Added "inline" to condense indicator settings and improve UI
- Refined simple lines of code
- Added TradingView Alerts ability for when there is a DNA color change
- Modified DNA line plotting to function as a stochastic oscillator, adding more momentum functionality to the DNA calculations that decipher bullish/bearish momentum. This removes a 'DNA Strand' and now provides overbought and oversold insights with visual colored zones. (Red) for overbought and (Green) for over sold.
- Added flow crossover identifiers to help users visualize when there is a change in flow surpassing the other.
- Added a convergence bar, this will turn green when DNA is bullish and flow matches, it will turn red when DNA is bearish and flow is also bearish, and if flow and DNA are not matching, it will appear gray until both DNA and flow match.
- Added an arrow for the flow meter, this measures the difference between the call and put flow. The higher the arrow goes indicates there is more call flow divergence and the lower the arrow goes, this means there is more put flow divergence. If the arrow stays in the middle, flow is undecided.
- The flow meter arrow will become green once call flow passes the threshold line or will turn red if the put flow crosses above the threshold line. Otherwise the arrow will be gray until flow passes the threshold requirement.
- Corrected the flow meter's arrow color on higher timeframes glitch
- Adjusted overbought/oversold color theme
- Added ability for user to change DNA line size
- Modified Colors
- Added Convergence bar label "CONVERGENCE" for easier identification of the tool and uses same coloring as the convergence bar for its text color
- Flow Divergences: identifies points where the call and put flow values diverge from the price action. This helps traders spot potential weakening trends or impending reversals in the market sentiment. These can be enabled or disabled in settings to plot on the actual price chart.
- DNA Reversions: identifies points where the DNA line indicates a potential reversion in market sentiment. These reversions signal potential changes in trend direction. These can be enabled or disabled to plot on DNA chart.
- Sentiment Table: Displaying the current market sentiment (Bullish, Bearish, Neutral), detailed flow readings (call and put flows), and multi-timeframe DNA colors. Providing Traders with quick and easy visual reference to the DNA tools. This can be enabled or disabled to appear on DNA chart, also has table placement and sizing options for mobile or desktop users.
- The Convergence bar has been converted to become the border color of the Sentiment Table.
- Additionally "TFC" changes color based on the table data all matching. If both different DNA timeframes and the charts match, TFC will become green if bullish alignment or red for bearish alignment to provide a simple visual cue.
- Added TradingView Alerts for all functions now to include DNA color change, Flow Divergences, DNA Reversions, and Flow Crossovers. This is to help traders get notified when there is a shift in sentiment on Gorb DNA when they don't have time to stare at charts.
Script su invito
Solo gli utenti approvati dall'autore possono accedere a questo script. È necessario richiedere e ottenere l'autorizzazione per utilizzarlo. Tale autorizzazione viene solitamente concessa dopo il pagamento. Per ulteriori dettagli, seguire le istruzioni dell'autore riportate di seguito o contattare direttamente GorbAlgo.
TradingView NON consiglia di pagare o utilizzare uno script a meno che non ci si fidi pienamente del suo autore e non si comprenda il suo funzionamento. Puoi anche trovare alternative gratuite e open-source nei nostri script della comunità.
Istruzioni dell'autore
Declinazione di responsabilità
Script su invito
Solo gli utenti approvati dall'autore possono accedere a questo script. È necessario richiedere e ottenere l'autorizzazione per utilizzarlo. Tale autorizzazione viene solitamente concessa dopo il pagamento. Per ulteriori dettagli, seguire le istruzioni dell'autore riportate di seguito o contattare direttamente GorbAlgo.
TradingView NON consiglia di pagare o utilizzare uno script a meno che non ci si fidi pienamente del suo autore e non si comprenda il suo funzionamento. Puoi anche trovare alternative gratuite e open-source nei nostri script della comunità.