OPEN-SOURCE SCRIPT
Aggiornato X-Day Capital Efficiency Score
This indicator helps identify the Most Profitable Movers for Your fixed Capital (ie, which assets offer the best average intraday profit potential for a fixed capital).
Unlike traditional volatility indicators (like ATR or % change), this script calculates how much real dollar profit you could have made each day over a custom lookback period — assuming you deployed your full capital into that ticker daily.
How it works:
Calculates the daily intraday range (high − low)
Filters for clean candles (where body > 60% of the candle range)
Assumes you invested the full amount of capital ($100K set as default) on each valid day
Computes an average daily profit score based on price action over the selected period (default set to 20 days)
Plots the score in dollars — higher = more efficient use of capital
Why It’s Useful:
Compare tickers based on real dollar return potential — not just % volatility
Spot low-priced, high-volatility stocks that are better suited for intraday or momentum trading
Inputs:
Capital ($): Amount you're hypothetically deploying (e.g., 100,000)
Look Back Period: Number of past days to average over (e.g., 20)
Note di rilascio
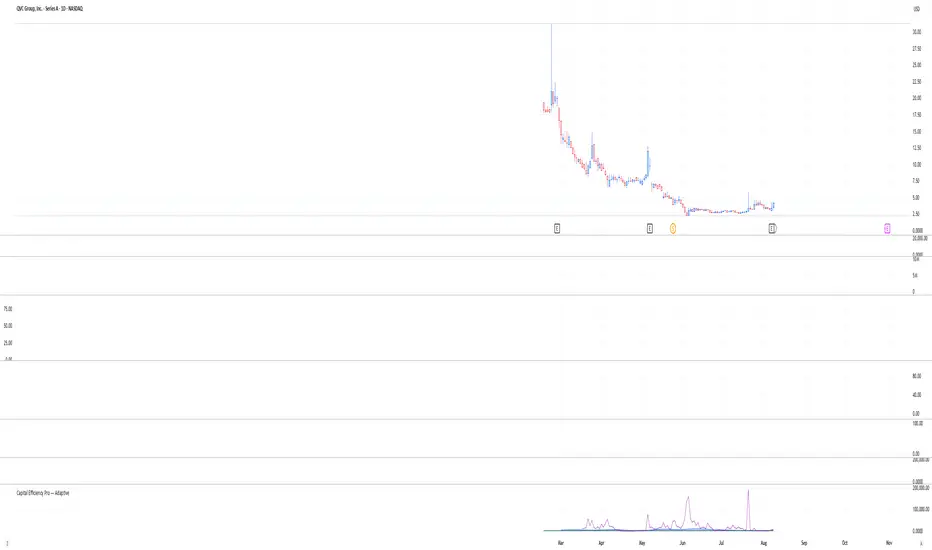
**Capital Efficiency Pro — Adaptive_Updated**This indicator helps traders quickly find symbols with the highest movement potential relative to their available capital per trade.
### What it does
- **Capital Efficiency Score (CapEff)**: Measures the average dollar movement per trade based on your set capital amount, counting only high-quality candles where the body is large relative to the total range.
- **CapEff SMA (blue line)**: Smooths the Capital Efficiency score for easier trend spotting.
- **Static Minimum Threshold (black line)**: Your baseline efficiency requirement — for example, if set to $2,000, that’s the “zero line” you’re comparing against. Blue shading appears when CapEff exceeds this level.
- **Adaptive Minimum Threshold (teal line)**: Optional feature that adjusts the minimum requirement based on market volatility (using VIX and/or SPY ATR%).
- **Adjusted CapEff (optional)**: Weights results toward liquid, consistent movers while penalizing excessive volatility.
- **Alerts**: Fires when CapEff meets or exceeds your chosen thresholds for easy watchlist scanning.
### How to use
1. **Set Capital per Trade** to your typical position size.
2. **Adjust Lookback Period** to control how many bars are analyzed.
3. **Choose Min Body/Range Ratio** to ignore small-bodied candles.
4. **Set Min Capital Efficiency ($)** to your personal movement requirement (this acts as the zero line).
5. Enable/disable **Adaptive Threshold** to account for changing market conditions.
6. Add **alerts** to watchlists for automatic daily symbol filtering.
**Best for**: Traders with a fixed budget per position who want to focus on symbols offering the highest potential return per trade.
Script open-source
Nello spirito di TradingView, l'autore di questo script lo ha reso open source, in modo che i trader possano esaminarne e verificarne la funzionalità. Complimenti all'autore! Sebbene sia possibile utilizzarlo gratuitamente, ricordiamo che la ripubblicazione del codice è soggetta al nostro Regolamento.
Declinazione di responsabilità
Le informazioni e le pubblicazioni non sono intese come, e non costituiscono, consulenza o raccomandazioni finanziarie, di investimento, di trading o di altro tipo fornite o approvate da TradingView. Per ulteriori informazioni, consultare i Termini di utilizzo.