OPEN-SOURCE SCRIPT
Pullback and Throwback Candle [TrendX_]

Pullback and Throwback candles can help traders determine the the potential reversal points
USAGE
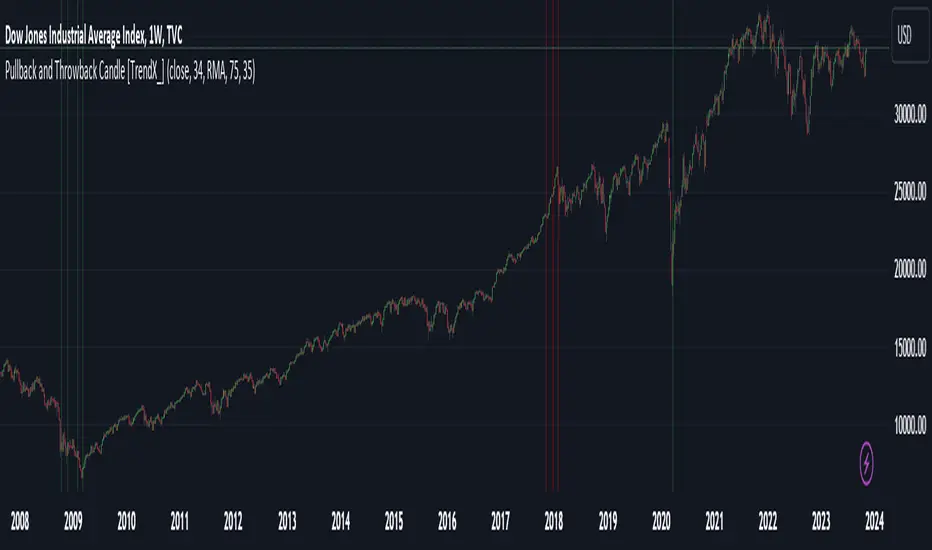
The indicator identifies pullback and throwback in overbought and oversold zones by measuring the distance between the price and its relative strength index.
A Pullback is an expected rebound in a downtrend (painted in green area), while a Throwback is a bounceback from an uptrend (painted in red area).
The strategy is useful for valuing reversal points. Accordingly, it can also be helpful for traders to use alongside other Technical Analysis indicators.
DISCLAIMER
This indicator is not financial advice, it can only help traders make better decisions.
There are many factors and uncertainties that can affect the outcome of any endeavor, and no one can guarantee or predict with certainty what will occur.
Therefore, one should always exercise caution and judgment when making decisions based on past performance.
Script open-source
Nello spirito di TradingView, l'autore di questo script lo ha reso open source, in modo che i trader possano esaminarne e verificarne la funzionalità. Complimenti all'autore! Sebbene sia possibile utilizzarlo gratuitamente, ricordiamo che la ripubblicazione del codice è soggetta al nostro Regolamento.
Declinazione di responsabilità
Le informazioni e le pubblicazioni non sono intese come, e non costituiscono, consulenza o raccomandazioni finanziarie, di investimento, di trading o di altro tipo fornite o approvate da TradingView. Per ulteriori informazioni, consultare i Termini di utilizzo.