OPEN-SOURCE SCRIPT
Aggiornato HTF FVG D/W/M 25%/50%/75% [MK]
Do you use HTF FVG (fair value gaps) in your trading strategy? Do you monitor price on the 25%/50%/75% levels within the FVG on a lower timeframe?
This script will allow the user to display either Daily, Weekly or Monthly FVGs on a lower timeframe chart. The script will then also show the 25%/50%/75% levels within the HTF FVG so traders can see how price reacts in the FVG.
For example, a Weekly FVG may be chosen by the trader as a possible reversal point, or somewhere to add to an existing position. The trader might want to see the FVG almost fully filled, then watch price climb up/down out of the Weekly FVG
before taking the trade.
Previously traders would draw the FVG to the chart, then use maybe the tradingview fib tool to display the 25%/50%/75% levels. The problem with this is that its easy to accidently move the fib while dragging the chart around.
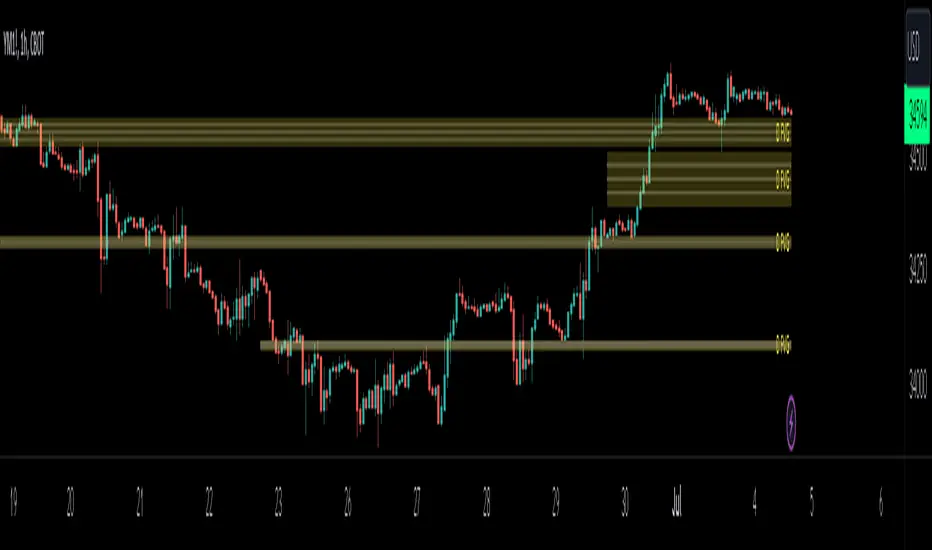
Chart below shows example of price almost filling a D FVG, then using the 25%/50%/75% levels as it climbs out of the FVG and reverses to the upside.

This script will allow the user to display either Daily, Weekly or Monthly FVGs on a lower timeframe chart. The script will then also show the 25%/50%/75% levels within the HTF FVG so traders can see how price reacts in the FVG.
For example, a Weekly FVG may be chosen by the trader as a possible reversal point, or somewhere to add to an existing position. The trader might want to see the FVG almost fully filled, then watch price climb up/down out of the Weekly FVG
before taking the trade.
Previously traders would draw the FVG to the chart, then use maybe the tradingview fib tool to display the 25%/50%/75% levels. The problem with this is that its easy to accidently move the fib while dragging the chart around.
Chart below shows example of price almost filling a D FVG, then using the 25%/50%/75% levels as it climbs out of the FVG and reverses to the upside.
Note di rilascio
added option to show FVG for any timeframeScript open-source
Nello spirito di TradingView, l'autore di questo script lo ha reso open source, in modo che i trader possano esaminarne e verificarne la funzionalità. Complimenti all'autore! Sebbene sia possibile utilizzarlo gratuitamente, ricordiamo che la ripubblicazione del codice è soggetta al nostro Regolamento.
Declinazione di responsabilità
Le informazioni e le pubblicazioni non sono intese come, e non costituiscono, consulenza o raccomandazioni finanziarie, di investimento, di trading o di altro tipo fornite o approvate da TradingView. Per ulteriori informazioni, consultare i Termini di utilizzo.
Script open-source
Nello spirito di TradingView, l'autore di questo script lo ha reso open source, in modo che i trader possano esaminarne e verificarne la funzionalità. Complimenti all'autore! Sebbene sia possibile utilizzarlo gratuitamente, ricordiamo che la ripubblicazione del codice è soggetta al nostro Regolamento.
Declinazione di responsabilità
Le informazioni e le pubblicazioni non sono intese come, e non costituiscono, consulenza o raccomandazioni finanziarie, di investimento, di trading o di altro tipo fornite o approvate da TradingView. Per ulteriori informazioni, consultare i Termini di utilizzo.