PROTECTED SOURCE SCRIPT
Aggiornato TFPS - TradFi Pressure Score
The Data-Driven Answer to a New Market Reality.
This indicator quantifies the pressure exerted by Wall Street on the crypto market across four critical dimensions: Risk Appetite, Fear, Liquidity Flows, and the Opportunity Cost of Capital. Our research has found that the correlation between this 4-dimensional pressure vector and crypto price action reaches peak values of 0.87. This is your decisive macro edge, delivered in real-time.
The Irreversible Transformation
A fundamental analysis of the last five years of market data proves an irreversible transformation: The crypto market has matured into a high-beta risk asset, its fate now inextricably linked to Traditional Finance (TradFi).
The empirical data is clear:
Bitcoin increasingly behaves like a leveraged version of the S&P 500.
The correlation to major stock indices is statistically significant and persistent.
The "digital gold" narrative is refuted by the data; the correlation to gold is virtually non-existent.
This means standard technical indicators are no longer sufficient. Tools like RSI or MACD are blind to the powerful, external macro context that now dominates price action. They see the effect, but not the cause.
The Solution: A 4-Dimensional Macro-Lens
The TradFi Pressure Score (TFPS) is the answer. It is an institutional-grade dashboard that aggregates the four most dominant external forces into a single, actionable score:
S&P 500 (SPY): The Pulse of Risk Appetite. A rising S&P signals a "risk-on" environment, fueling capital flows into crypto.
VIX: The Market's Fear Gauge. A rising VIX signals a "risk-off" flight to safety, draining liquidity from crypto.
DXY (US-Dollar Index): The Anchor of Global Liquidity. A strong Dollar (rising DXY) tightens financial conditions, creating powerful headwinds for risk assets like Bitcoin.
US 10Y Yield: The Opportunity Cost of Capital. Rising yields make risk-free assets more attractive, pulling capital away from non-yielding assets like crypto.
What makes the TFPS truly unique?
1. Dynamic Weighting (The Secret Weapon):
Which macro factor matters most right now? Is it a surging Dollar or a collapsing stock market? The TFPS answers this automatically. It continuously analyzes the correlation of all four components to your chosen asset (e.g., Bitcoin) and adjusts their influence in real-time. The dashboard shows you the exact live weights, ensuring you are always focused on the factor that is currently driving the market.
2. Adaptive Engine:
The forces driving a 15-minute chart are different from those driving a daily chart. The TFPS engine automatically recalibrates its internal lookback periods to your chosen timeframe. This ensures the score is always optimally relevant, whether you are a day trader or a swing trader.
3. Designed for Actionable Insights
The Pressure Line: The indicator's core output. Is its value > 0 (tailwind) or < 0 (headwind)? This provides an instant, unambiguous read on the macro environment for your trade.
The Z-Score (The Contrarian Signal): The background "Stress Cloud" and the discrete dots provide early warnings of extreme macro greed or fear. Readings above +2 or below -2 have historically pinpointed moments of market exhaustion that often precede major trend reversals.
Lead/Lag Status: Gain a critical edge by knowing who is in the driver's seat. The dashboard tells you if TradFi is leading the price action or if crypto is moving independently, allowing you to validate your trade thesis against the dominant market force.
This is a public indicator with protected source code
Access is now available for traders who understand the new market reality at the intersection of crypto and traditional finance.
You are among the first to leverage what is a new standard for macro analysis in crypto trading. Your feedback is highly valued as I continue to refine this tool.
Follow for updates and trade with the full context!
Note di rilascio
What is the TFPS Indicator?The TradFi Pressure Score (TFPS) is a specialized indicator developed to measure the influence and pressure of traditional financial markets (TradFi) on the crypto market.
It answers the question:
"Are global market sentiments currently supporting or hindering crypto prices?"
The selection of its four components (S&P 500, VIX, DXY, US 10Y Yield) is the result of extensive quantitative analysis. They represent the four crucial quadrants of TradFi sentiment:
Risk Appetite, Market Stress, Liquidity, and Macroeconomic Expectations.
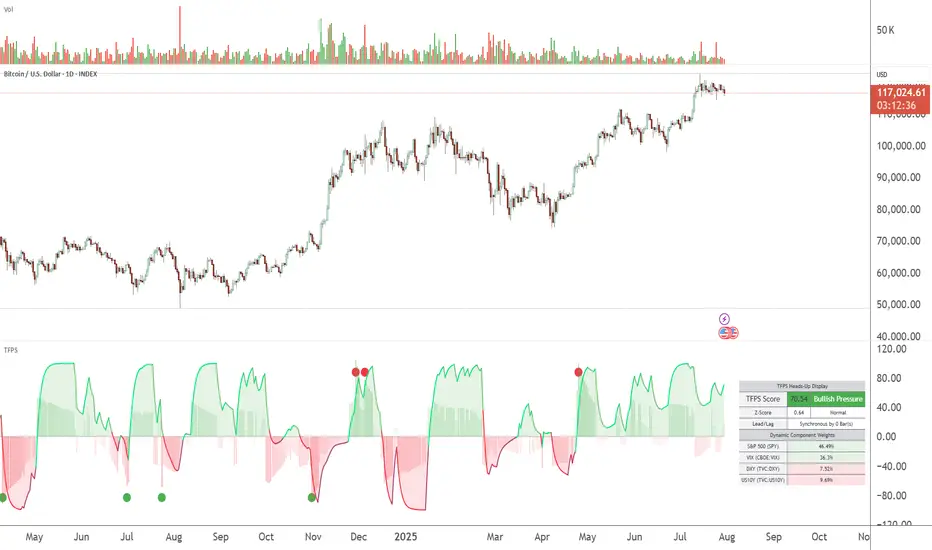
The Visual Components in Detail
To master the indicator, you need to understand its four main components:
1. The Main Line (The "Heartbeat" of Market Pressure):
A line above zero (> 0) means the combined pressure is positive (bullish / supportive for crypto).
A line below zero (< 0) signals negative pressure (bearish / burdensome for crypto).
The height/depth of the line indicates the strength of the pressure on a scale of +/-100.
A bright color (light green/light red) indicates an increase in the strength of the pressure. A dark color signals a decrease.
2. The "Stress Cloud" (The Z-Score):
The statistical deviation is now displayed as a cloud of bars in the background.
It measures how extraordinary the current pressure is compared to its recent past.
The size and opacity of the bars increase as the current situation becomes more extreme. Small, transparent bars mean "normal state," while large, opaque bars indicate a statistically significant anomaly.
3. The Extreme Signals (The Turning Point Pre-Markers):
These are the most important signals for traders. A single dot marks the beginning of an extreme phase.
A red dot at the top appears when the "stress" exceeds +2 standard deviations. This signals extreme euphoria and a possible exhaustion of the uptrend.
A green dot at the bottom appears when the "stress" falls below -2 standard deviations. This signals extreme panic/capitulation and a possible bottom formation.
4. The "Heads-Up Display" (The Cockpit):
All important data is now summarized in a single, clear cockpit on the right side. It contains the exact TFPS Score, the Z-Score status, the Lead/Lag status, and the dynamic component weights, color-coded by their current influence (Green = high, Yellow = medium, Red = low).
How to Use the Indicator: The Three Core Questions
As a trader, you can use the TFPS to answer three crucial questions:
Question 1: Do I have tailwinds or headwinds from the global markets?
Answer: Look at the main line. If it's above zero (green), you have tailwinds. If it's bright, the tailwinds are increasing. If it's below zero (red), you have headwinds.
Question 2: Is the current situation extreme and ripe for a reversal?
Answer: Pay attention to the red and green extreme signals (dots).
The appearance of these dots signals that a phase of greed or panic has reached its peak, which often precedes turning points.
The "Stress Cloud" shows you the intensity.
Question 3: Should I be listening more to NASDAQ or the crypto community right now?
Answer: Take a look at the Dashboard. If "TradFi LEADS," macro news and the development of S&P 500 & Co. are extremely important. If your crypto asset is leading, internal crypto factors are more relevant.
Configuration
The clear recommendation: Leave most settings at their default values.
Leaving the Engine Parameters at 0 (Auto-Adaptive) brings out the indicator's greatest strength.
The dynamic weights are the core intelligence and should remain activated.
Under "4. Visual Settings," you can adjust the "Dashboard Theme" to your light or dark chart background.
Under "5. Historical Inspector," you can display the dashboard for any point in the past to analyze historical events.
Script protetto
Questo script è pubblicato come codice protetto. Tuttavia, è possibile utilizzarle liberamente e senza alcuna limitazione – ulteriori informazioni qui.
ayana-ailab | Trade the cause, not the effect. Our "TradFi Pressure Score" reveals what truly moves the crypto market (S&P 500, VIX, DXY). Your AI-powered edge, delivered in a single indicator. ► Find our tools on TradingView.
Declinazione di responsabilità
Le informazioni e le pubblicazioni non sono intese come, e non costituiscono, consulenza o raccomandazioni finanziarie, di investimento, di trading o di altro tipo fornite o approvate da TradingView. Per ulteriori informazioni, consultare i Termini di utilizzo.