OPEN-SOURCE SCRIPT
Steroid RSI w/ Overbought & Oversold Alert
/version=2
//By Tantamount
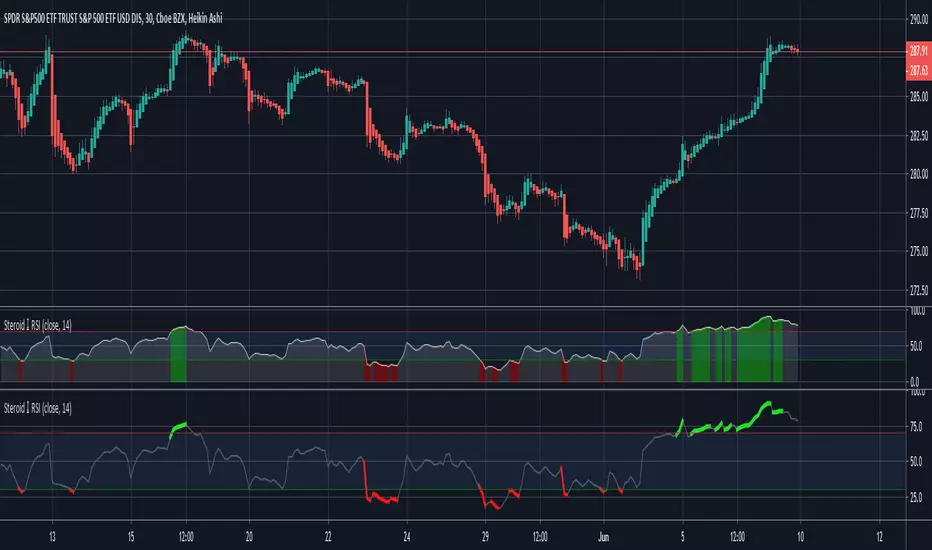
//RSI with overbought and oversold alert features! Highly configurable indicator that includes a Topography map feature, used to detect & easily show threshold crossovers.
//RSI is used to measure the velocity and change of directional price movements. It is very useful to help determine when an asset is reaching an overbought or oversold condition.
//This RSI tool comes loaded with features and is easily configurable back to standard RSI or configure with your own preferences.
Customize to your liking:
Topo map view or standard with highlighted crossover color.
If you like this tool and would like to DONATE/TIP:
Stellar XLM address: GA5XIGA5C7QTPTWXQHY6MCJRMTRZDOSHR6EFIBNDQTCQHG262N4GGKTM
Bitcoin BTC address: 3QwPUnZvAKBXBMU7WMckNgDyfv6PApYduA
//By Tantamount
//RSI with overbought and oversold alert features! Highly configurable indicator that includes a Topography map feature, used to detect & easily show threshold crossovers.
//RSI is used to measure the velocity and change of directional price movements. It is very useful to help determine when an asset is reaching an overbought or oversold condition.
//This RSI tool comes loaded with features and is easily configurable back to standard RSI or configure with your own preferences.
Customize to your liking:
Topo map view or standard with highlighted crossover color.
If you like this tool and would like to DONATE/TIP:
Stellar XLM address: GA5XIGA5C7QTPTWXQHY6MCJRMTRZDOSHR6EFIBNDQTCQHG262N4GGKTM
Bitcoin BTC address: 3QwPUnZvAKBXBMU7WMckNgDyfv6PApYduA
Script open-source
Nello spirito di TradingView, l'autore di questo script lo ha reso open source, in modo che i trader possano esaminarne e verificarne la funzionalità. Complimenti all'autore! Sebbene sia possibile utilizzarlo gratuitamente, ricordiamo che la ripubblicazione del codice è soggetta al nostro Regolamento.
Declinazione di responsabilità
Le informazioni e le pubblicazioni non sono intese come, e non costituiscono, consulenza o raccomandazioni finanziarie, di investimento, di trading o di altro tipo fornite o approvate da TradingView. Per ulteriori informazioni, consultare i Termini di utilizzo.